Use these links to rapidly review the document
TABLE OF CONTENTS
PART III
UNITED STATES
SECURITIES AND EXCHANGE COMMISSION
Washington, D.C. 20549
FORM 10-K
ANNUAL REPORT PURSUANT TO SECTION 13 OR 15(d) OF THE
SECURITIES EXCHANGE ACT OF 1934
For the Fiscal Year Ended December 31, 2008
Commission File Number 1-4949
CUMMINS INC.
| Indiana (State of Incorporation) |
35-0257090 (IRS Employer Identification No.) |
500 Jackson Street
Box 3005
Columbus, Indiana 47202-3005
(Address of principal executive offices)
Telephone (812) 377-5000
Securities registered pursuant to Section 12(b) of the Act:
| Title of each class | Name of each exchange on which registered | |
|---|---|---|
| Common Stock, $2.50 par value | New York Stock Exchange |
Securities registered pursuant to Section 12(g) of the Act: None.
Indicate by check mark if the registrant is a well-known seasoned issuer, as defined in Rule 405 of the Securities Act. Yes ý No o
Indicate by check mark if the registrant is not required to file reports pursuant to Section 13 or Section 15(d) of the Act. Yes o No ý
Indicate by check mark whether the registrant: (1) has filed all reports required to be filed by Section 13 or 15(d) of the Securities Exchange Act of 1934 during the preceding 12 months (or for such shorter period that the registrant was required to file such reports) and (2) has been subject to such filing requirements for the past 90 days. Yes ý No o
Indicate by check mark if disclosure of delinquent filers pursuant to Item 405 of Regulation S-K is not contained herein, and will not be contained, to the best of registrant's knowledge, in definitive proxy or information statements incorporated by reference in Part III of this Form 10-K or any amendment to this Form 10-K. o
Indicate by check mark whether the registrant is a large accelerated filer, an accelerated filer, a non-accelerated filer, or a smaller reporting company. See the definition of "large accelerated filer," "accelerated filer" and "smaller reporting company" in Rule 12b-2 of the Exchange Act. (Check one):
| Large accelerated filer ý | Accelerated filer o | Non-accelerated filer o | Smaller reporting company o |
Indicate by check mark whether the registrant is a shell company (as defined in Rule 12b-2 of the Exchange Act). Yes o No ý
The aggregate market value of the voting stock held by non-affiliates was approximately $13 billion at June 29, 2008.
As of January 30, 2009, there were 201,352,073 shares outstanding of $2.50 par value common stock.
Documents Incorporated by Reference
Portions of the registrant's definitive Proxy Statement filed with the Securities and Exchange Commission pursuant to Regulation 14A are incorporated by reference in Part III of this Form 10-K.
2
Cummins Inc. and its consolidated subsidiaries are hereinafter sometimes referred to as "Cummins," "the Company," "the registrant," "we," "our," or "us."
CAUTIONARY STATEMENTS REGARDING FORWARD-LOOKING INFORMATION
Certain parts of this annual report contain forward-looking statements that are based on current expectations, estimates and projections about the industries in which we operate and management's beliefs and assumptions. Forward-looking statements are generally accompanied by words, such as "anticipates," "expects," "forecasts," "intends," "plans," "believes," "seeks," "estimates" or similar expressions. These statements are not guarantees of future performance and involve certain risks, uncertainties and assumptions, which we refer to as "future factors," which are difficult to predict. Therefore, actual outcomes and results may differ materially from what is expressed or forecasted in such forward-looking statements. Future factors that could cause our results to differ materially from the results discussed in such forward-looking statements are discussed below. We undertake no obligation to update publicly any forward-looking statements, whether as a result of new information, future events or otherwise. Future factors that could affect the outcome of forward-looking statements include the following:
In addition, such statements could be affected by general industry and market conditions and growth rates, general domestic and international economic conditions, including the price of crude oil (diesel fuel), interest rate and currency exchange rate fluctuations, commodity prices and other future factors.
3
Cummins Inc. was founded in 1919 in Columbus, Indiana as one of the first diesel engine manufacturers. We are a global power leader that designs, manufactures, distributes and services diesel and natural gas engines, electric power generation systems and engine-related component products, including filtration and exhaust aftertreatment, fuel systems, controls and air handling systems. We sell our products to Original Equipment Manufacturers (OEMs), distributors and other customers worldwide. We serve our customers through a network of more than 500 company-owned and independent distributor locations and approximately 5,200 dealer locations in more than 190 countries and territories.
We have four complementary operating segments that share technology, customers, strategic partners, brand recognition and our distribution network to gain a competitive advantage in their respective markets. In each of our operating segments, we compete worldwide with a number of other manufacturers and distributors that produce and sell similar products. Our products primarily compete on the basis of price, performance, fuel economy, speed of delivery, quality and customer support. Financial information about our operating segments, including geographic information, is incorporated by reference from Note 24 to the Consolidated Financial Statements.
In 2008, our Engine segment sales accounted for 50 percent of our net sales and 41 percent of our earnings before interest and taxes (EBIT), both measured before intersegment eliminations. Our Engine segment manufactures and markets a broad range of diesel and natural gas- powered engines under the Cummins brand name, as well as certain customer brand names, for the heavy- and medium-duty truck, bus, recreational vehicle (RV), light-duty automotive, agricultural, construction, mining, marine, oil and gas, rail and governmental equipment markets. We offer a wide variety of engine products with displacement from 1.4 to 91 liters and horsepower ranging from 31 to 3,500. In addition, we provide a full range of new parts and service, as well as remanufactured parts and engines, through our extensive distribution network.
The principal customers of our heavy- and medium-duty truck engines include truck manufacturers, such as PACCAR, International Truck and Engine Corporation (Navistar International Corporation), Volvo Trucks North America, Daimler Trucks North America (formerly Freightliner LLC), Ford and Volkswagen AG. We sell our industrial engines to manufacturers of construction, agricultural and marine equipment, including Case New Holland, Komatsu, Hitachi, Ingersoll Rand, Brunswick and Terex. The principal customers of our light-duty on-highway engines are Chrysler and manufacturers of RVs.
In the markets served by our Engine segment, we compete with independent engine manufacturers as well as OEMs who manufacture engines for their own products. Our primary competitors in North America are Caterpillar, Inc., Detroit Diesel Corporation, Volvo Powertrain and International Truck and Engine Corporation (Engine Division). Our primary competitors in international markets vary from country to country, with local manufacturers generally predominant in each geographic market. Other engine manufacturers in international markets include Mercedes Benz, Volvo, Renault Vehicules Industriels, Scania, Weichai Power Co. Ltd., Nissan Diesel Motor Co., Ltd., Yanmar and Deutz.
4
Our Engine segment organizes its engine, parts and service businesses around the following end-user markets:
Heavy-Duty Truck
We manufacture a complete line of diesel engines that range from 310 horsepower to 600 horsepower serving the worldwide heavy-duty truck market. We offer the ISM and ISX engines and in Australia, the Signature 620 series engines. Most major heavy-duty truck manufacturers in North America offer our diesel engines as standard or optional power. As reported by Wards Automotive (Wards) for 2008, our market share of the Group II engine market for NAFTA Class 8 heavy-duty trucks was 45 percent. As reported by the National Association of Truck, Bus and Tractor Producers (ANPACT) in Mexico and the National Automotive Manufacturers Association South Africa (NAMASA), we are the market leaders in Mexico and South Africa, respectively. Our largest customer for heavy-duty truck engines in 2008 was PACCAR with sales representing almost 7 percent of consolidated net sales.
We have long-term supply agreements with two key customers. We have a long-term agreement with Volvo Trucks North America, Inc. under which we act as its sole external engine supplier. We also have a long-term supply agreement with PACCAR covering our heavy-duty engine product line. These supply agreements provide long-term, stable pricing for engines and eliminate certain dealer and end-user discounts, in order to provide our customers with full responsibility for total vehicle cost and pricing. In addition, these agreements enable us to work more closely with our customers in joint engineering efforts earlier, delivering seamlessly integrated, dependable vehicles to the market. The joint sales and service efforts provide better customer support at reduced cost to our partners.
Medium-Duty Truck and Bus
We manufacture a product line of medium-duty diesel engines ranging from 200 horsepower to 400 horsepower serving medium-duty and inter-city delivery truck customers worldwide. We sell our ISB and ISC series engines and engine components to medium-duty truck manufacturers in North America, Asia, Europe and South America. In 2008, as reported by Wards our market share for diesel powered medium-duty trucks in the North American Class 7 medium-duty truck market grew to above 38 percent. We are the exclusive medium-duty engine provider for PACCAR worldwide and Ford in Brazil. As reported by American Public Transportation Association (APTA), through our joint venture with Westport Innovations Inc., we are the largest manufacturer of natural gas bus engines in the U.S. as well as a significant global provider of natural gas engines. We also offer our ISB, ISC and ISL diesel engines and their alternative fueled counterparts for school buses, transit buses and shuttle buses worldwide. Key markets include North America, Latin America, Europe and Asia. Ford, Volkswagen AG, Daimler Trucks North America (formerly Freightliner LLC) and PACCAR are our major customers in this worldwide market.
Light-Duty Automotive and RV
We are the exclusive provider of diesel engines used by Chrysler in its Dodge Ram trucks. Our relationship with Chrysler extends nearly 20 years and in 2008 we shipped over 66,000 engines for use in Dodge Ram trucks. The 6.7-liter Dodge Ram Turbo Diesel engine offers best in class 650 lb-ft of torque and 350 horsepower.
We have gained market share and are a leading manufacturer of diesel engines for use in the Class A motor home market. Based on the Recreational Vehicle Industry Association (RVIA), we believe our market share is above 90 percent of the diesel engines in retail Class A motor home sales and that the diesel segment of the Class A motor home market now exceeds 50 percent, indicating a growing preference for diesel power for this application.
5
Industrial
Our mid-range, heavy-duty and high-horsepower engines power a wide variety of equipment in the construction, agricultural, mining, rail, government, oil and gas, power generation and commercial and recreational marine applications throughout the world. Our engine range extends from the A-series to the QSV91 allowing us to penetrate the light utility market with smaller engines up to the largest mining machines with our QSK60 and QSK78 engines and the QSV91 for power generation applications. Across these markets we have major customers in North America, South America, Europe, South Korea, Japan, China and the South Pacific.
In 2008, sales from our power generation segment represented 20 percent of our net sales and 28 percent of our EBIT, both measured before intersegment eliminations. This operating segment is one of the most integrated providers of power solutions in the world, designing or manufacturing most of the components that make up power generation systems, including engines, controls, alternators, transfer switches and switchgear. This operating segment is a global provider of power generation systems, components and services for a diversified customer base by providing standby power, distributed generation power, as well as auxiliary power needs in specialty mobile applications. Standby power solutions are provided to customers who rely on uninterrupted sources of power to meet the needs of their customers. Distributed generation power solutions are provided to customers with less reliable electrical power infrastructures, typically in developing countries. In addition, our power solutions provide an alternative source of generating capacity, which is purchased by utilities, independent power producers and large power customers for use as prime or peaking power and is located close to its point of use. Mobile power provides a secondary source of power (other than drive power) for mobile applications.
Our power generation products are marketed under two brands; Cummins Power Generation for the commercial products and projects and Cummins Onan for the consumer products. Both include diesel, natural gas, gasoline and alternative-fuel electrical generator sets for all market segments including commercial, telecommunications, data centers, office buildings, hospitals, factories, municipalities, utilities, universities, recreational vehicles, boats and homes. We are a worldwide leader in auxiliary generator sets for RVs, commercial vehicles and recreational marine applications. Our energy solutions business provides full-service power solutions for customers including generating equipment, long-term maintenance contracts and turnkey power solutions. We also sell reciprocating generator drive engines across a large power range to other generator set assemblers.
Cummins Generator Technologies (CGT) is a leader in the alternator industry and supplies its products internally as well as to other generator set assemblers. CGT products are sold under the Stamford, AVK and Markon brands and range in output from 0.6kVA to 30,000 kVA.
This operating segment continuously explores emerging technologies, such as fuel cells, wind and hybrid solutions and provides integrated power generation products utilizing technologies other than reciprocating engines. We use our own research and development capabilities as well as leverage business partnerships to develop cost-effective and environmentally sound power solutions.
Our customer base for power generation products is highly diversified, with customer groups varying based on their power needs. India, the Middle East, the United Kingdom (U.K.) and Western Europe are four of our largest geographic markets outside of North America.
This operating segment competes with a variety of engine manufacturers and generator set assemblers across the world. Caterpillar, Inc., Tognum (MTU) and Mitsubishi (MHI) remain our primary competitors, but we also compete with FG Wilson (Caterpillar group), Kohler, SDMO (Kohler
6
group), Generac and numerous regional generator set assemblers. CGT competes globally with Emerson Electric Co., Marathon Electric and Meccalte, among others.
In 2008, our Components segment sales accounted for 18 percent of our net sales and 13 percent of our EBIT, both measured before intersegment eliminations. Our Components segment produces filters, fuel systems, aftertreatment systems, intake and exhaust systems and we believe we are the largest worldwide supplier of turbochargers for commercial diesel applications between 3.8 and 16 liter engines. This operating segment has four businesses: Cummins Filtration, Cummins Turbo Technologies, Cummins Fuel Systems and Cummins Emission Solutions. We manufacture filtration and exhaust systems for on- and off-highway heavy-duty equipment and we are a supplier of filtration products for industrial and passenger car applications. In addition, we develop aftertreatment and exhaust systems to help our customers meet increasingly stringent emissions standards and fuel systems which to date have primarily supplied our Engine segment and our partner Scania.
We believe our filtration business is the world's leading supplier of filtration, exhaust, coolant and chemical products. We offer over 27,000 filtration products including air, coolant, fuel and hydraulic filters, antifreeze and coolant additives, catalysts, particulate filters, controllers and other filtration systems to OEMs, dealer/distributors and end-user markets. Our products are produced and sold in global markets, including North America, South America, Europe, Asia, Africa and Australia. Our filtration business also makes products for the automotive specialty filtration market and the industrial filtration market through our Kuss subsidiary.
Our turbo technologies business designs, manufactures and markets turbochargers for commercial and light-duty diesel applications with manufacturing facilities in five countries and sales and distribution worldwide. Cummins Turbo Technologies provides critical technologies for engines to meet challenging performance requirements and worldwide emissions standards, including variable geometry turbochargers. We believe it is the market leader in turbochargers for heavy-duty applications in North America and one of the leaders in Europe.
Our fuel systems business designs and manufactures new and replacement fuel systems primarily for heavy-duty on-highway diesel engine applications and also remanufactures fuel systems and electronics. In our Engine segment, Scania and Komatsu are the primary customers for our fuel systems business. Scania is our partner in two joint ventures within the fuel systems business. The Cummins-Scania High Pressure Injection, L.L.C. joint venture currently manufactures fuel systems used by Cummins and Scania while the Cummins-Scania XPI joint venture currently produces next generation fuel systems for medium-duty and heavy-duty engines. See further discussion of our joint ventures in the Joint Ventures, Alliances and Non-Wholly-Owned Subsidiaries section.
Cummins Emission Solutions (CES) business designs and manufactures aftertreatment and exhaust systems to help our customers meet increasingly stringent emissions standards. We believe we are the leading supplier of aftertreatment products for EPA 2007 emissions standards in North America and for Euro IV standards in Europe. CES expanded its international manufacturing capabilities with new manufacturing facilities leases signed in 2007 in Beijing, China and Sao Paulo, Brazil, intended for use on Cummins engines meeting Euro IV and Euro V emissions standards, with production beginning in 2011 and 2012, respectively.
Customers of our Components segment generally include truck manufacturers and other OEMs, many of which are also customers of our Engine segment, such as PACCAR, CNH Global N.V., International Truck and Engine, Volvo, Iveco and other manufacturers that use our filtration products in their product platforms. Components products are sold to truck manufacturers and OEMs for use on both Cummins engines and other proprietary engine lines. Our customer base for replacement filtration parts is highly fragmented and primarily consists of various end-users of on-highway and off-highway
7
vehicles and equipment. In addition, Components sells products to the Engine segment to complement its products and to the Distribution segment for sale to their customers.
Our Components segment competes with other manufacturers of filtration, exhaust and fuel systems and turbochargers. Our primary competitors in these markets include Donaldson Company, Inc., Clarcor Inc., Mann+Hummel Group, Tokyo Roki Co., Ltd., Borg-Warner, Bosch, Tenneco and Honeywell International.
In 2008, Distribution segment sales accounted for 12 percent of our net sales and 18 percent of our EBIT, both measured before intersegment eliminations. Our Distribution segment consists of 18 company-owned and 18 joint venture distributors that distribute the full range of our products and services to end-users at approximately 300 locations in over 70 countries and territories. In North America, this network is mostly comprised of partially-owned distributors. Internationally, our network consists of independent, partially-owned and wholly-owned distributors. Through this network, our trained personnel provide parts and service to our customers, as well as full-service solutions, including maintenance contracts, engineering services and integrated products where we customize our products to cater to specific end-users. Our company-owned distributors are located in key markets, including India, China, Japan, Australia, Europe, the Middle East, South Africa, Brazil, North America and Russia. Our distributors also serve and develop dealers, predominantly OEM dealers, in their territories by providing technical support, tools, training, parts and product information.
In addition to managing our investments in wholly-owned and partially-owned distributors, our Distribution segment is responsible for managing the performance and capabilities of our independent distributors. Our distributors collectively serve a highly diverse customer base with approximately 52 percent of their 2008 revenues being from the wholesale of new power equipment (engines and power generation equipment) and the remaining portion consisting of parts and service repairs.
In 2008, we purchased a majority interest in three previously independent North American distributors and an equity interest in another North American distributor in order to increase our ownership interests in key portions of the distribution channel. See Note 21 to the Consolidated Financial Statements for detailed information regarding these purchases.
Financial information about our wholly-owned distributors and distributors accounted for under the equity method are incorporated by reference from Notes 1 and 2 to the Consolidated Financial Statements.
The distributors that we own or operate compete with distributors or dealers that offer similar products. In many cases, these competing distributors or dealers are owned by, or affiliated with, the companies that are listed above as competitors of the Engine, Power Generation or Components segments. These competitors vary by geographical location.
JOINT VENTURES, ALLIANCES AND NON-WHOLLY-OWNED SUBSIDIARIES
We have entered into a number of joint venture agreements and alliances with business partners around the world. Our joint ventures are either manufacturing or distribution entities. We also own a controlling interest in a non-wholly-owned manufacturing subsidiary.
Distribution Entities
Our distribution channel in North America includes 13 partially-owned entities. Our equity interests in these nonconsolidated entities range from 30 percent to 50 percent. While each distributor is a separate legal entity, the business of each is the same as that of our wholly-owned distributors based in other parts of the world. All of our distributors, irrespective of the legal structure, offer the
8
full range of our products and services to customers and end-users in their respective markets. See further discussion of distribution entities at Distribution segment section previously discussed.
We also have an equity interest in four international distributors with interests ranging from 20 percent to 50 percent.
Manufacturing Entities
Manufacturing joint ventures are formed with customers and allow us to increase market penetration in geographic regions, reduce capital spending, streamline our supply chain management and develop technologies. Our largest manufacturing ventures are based in China and are included in the list below. Our engine manufacturing joint ventures are supplied by our Components Segment in the same manner as they supply our wholly-owned engine and power generation manufacturing facilities. Components segment joint ventures provide fuel system, filtration and turbocharger products that are used in our engines as well as some competitors' products. These joint ventures are all unconsolidated ventures, unless specifically noted below.
Dongfeng Cummins Engine Company, Ltd. (DCEC) is a joint venture with Dongfeng Automotive Corporation, a subsidiary of Dongfeng Motor Company (Dongfeng), one of the largest medium-duty truck manufacturers in China. DCEC produces Cummins B, C and L Series four- to nine-liter mechanical engines, full-electronic diesel engines, with a power range from 100 to 370 horsepower, and natural gas engines.
Shanghai Fleetguard Filter Co., Ltd. is a joint venture with Dongfeng that manufactures filtration and exhaust systems.
The East Asia Technical center is a joint venture with DCEC that provides engineering and technical development services for the full range of Cummins products built in China. A series of projects are underway in the technical center, including the development of a new 13-liter engine platform for the Chinese heavy-duty truck market served by DCEC. The results of the East Asia Technical center are included in our Consolidated Financial Statements.
Chongqing Cummins Engine Company, Ltd. is a joint venture with Chongqing Heavy Duty Vehicle Group that manufactures several models of our heavy-duty and high-horsepower diesel engines, primarily serving the industrial and stationary power markets in China.
Tata Cummins Limited is a joint venture with Tata Motors Ltd., the largest automotive company in India and a member of the Tata group of companies. This joint venture manufactures the Cummins B Series engine in India for use in trucks manufactured by Tata Motors, as well as for various industrial and power generation applications.
Cummins MerCruiser Diesel Marine LLC is a joint venture with Mercury Marine, a division of Brunswick Corporation, to develop, manufacture and sell recreational marine diesel products, including engines, sterndrive packages, inboard packages, instrument and controls, service systems and replacement and service parts and assemblies, complete integration systems and other related products.
9
Cummins Westport, Inc. is a joint venture with Westport Innovations Inc., located in British Columbia, Canada, which markets and sells automotive spark-ignited natural gas engines worldwide and also provides for joint technology projects between Westport and Cummins on low-emission technologies of mutual interest.
We have a broad relationship with Komatsu Ltd., including four joint ventures and numerous exclusive supply arrangements. Komatsu Cummins Engine Co., a joint venture in Japan, manufactures Cummins B Series engines. Cummins Komatsu Engine Corporation (CKEC), a joint venture in the U.S., builds high-horsepower Komatsu-designed engines. Industrial Power Alliance Ltd., a joint venture in Japan, designs the next generation of industrial engines. Komatsu Cummins Chile, our fourth joint venture with Komatsu Ltd., is a distributor in Chile. CKEC and its results are consolidated in our Consolidated Financial Statements in accordance with Financial Accounting Standards Board (FASB) Interpretation No. 46 (revised December 2003) Consolidation of Variable Interest Entities an interpretation of ARB No. 51 (FIN 46(R)). See Note 22 to the Consolidated Financial Statements.
ZAO Cummins Kama is a joint venture with KAMAZ Inc., the largest vehicle manufacturer in Russia, to produce B Series engines. Engines manufactured by ZAO Cummins Kama are used in KAMAZ trucks and buses, as well as trucks, buses and agricultural equipment produced by other manufacturers in Russia, Belarus and the Ukraine.
Xian Cummins Engine Company (XCEC) is a joint venture with Shaanxi Heavy Vehicle Group Co. and Shaanxi Heavy Duty Truck Co., Ltd. in Xian, China, to manufacture the Cummins ISM heavy-duty diesel engine for use in Shaanxi trucks and for sale to outside customers.
Cummins-Scania High Pressure Injection, L.L.C. is a joint venture with Scania to produce fuel systems for heavy-duty diesel engines. We own 70 percent of this joint venture and its results are included in our Consolidated Financial Statements. Cummins-Scania XPI (XPI), a second joint venture with Scania, produces the next generation fuel systems for mid-range and heavy-duty on-highway truck engines. XPI is a 50/50 joint venture that builds upon other Cummins-Scania partnerships. In 2007, XPI began production of fuel systems that support our C- and L-Series engines.
Beijing Foton Cummins Engine Co., Ltd., is a 50/50 joint venture with Beijing Foton Motor Co., Ltd. to produce two new families of Cummins light-duty, high performance diesel engines in Beijing beginning in late 2009. The engines will be used in light-duty commercial trucks, pickup trucks, multipurpose and sport utility vehicles. Certain types of marine, small construction equipment and industrial applications will also be served by this engine family.
Non-Wholly-Owned Manufacturing Subsidiary
We have a controlling interest in Cummins India Ltd. (CIL), which is a publicly listed company on various stock exchanges in India. CIL produces mid-range, heavy-duty and high-horsepower engines, as
10
well as generators for the Indian and export markets. CIL also produces compressed natural gas spark-ignited engines licensed from the CWI joint venture.
Financial information about our investments in joint ventures and alliances is incorporated by reference from Notes 1, 2 and 22 to the Consolidated Financial Statements.
In the event of a change of control of either party to these joint ventures and other strategic alliances, certain consequences may result including automatic termination and liquidation of the venture, exercise of "put" or "call" rights of ownership by the non-acquired partner, termination or transfer of technology license rights to the non-acquired partner and increases in component transfer prices to the acquired partner. We will continue to evaluate joint venture and partnership opportunities in order to penetrate new markets, develop new products and generate manufacturing and operational efficiencies.
We source our materials and manufactured components from leading suppliers both domestically and internationally. We machine and assemble some of the components used in our engines and power generation units, including blocks, heads, turbochargers, rods, camshafts, crankshafts, filters, exhaust systems, alternators and fuel systems. We single source approximately 80 to 85 percent of the total types of parts in our product designs. We have long term agreements with critical suppliers who are the sole source for specific products or supply items. Although we elect to source a relatively high proportion of our total raw materials and component requirements from sole suppliers, we have established a process to annually review our sourcing strategies with a focus on the reduction of risk, which has led us to dual source critical components. We are also developing suppliers in many global or emerging markets to serve our businesses across the globe and provide alternative sources in the event of disruption from existing suppliers.
We own or control a significant number of patents and trademarks relating to the products we manufacture. These patents and trademarks have been granted and registered over a period of years. Although these patents and trademarks are generally considered beneficial to our operations, we do not believe any patent, group of patents, or trademark (other than our leading brand house trademarks) is considered significant to our business.
While individual product lines may experience modest seasonal declines in production, there is no material effect on the demand for the majority of our products on a quarterly basis. However, our Power Generation segment normally experiences seasonal declines in the first quarter of our fiscal year due to general declines in construction spending during this period and our Distribution segment normally experiences seasonal declines in first quarter business activity due to holiday periods in Asia and Australia.
We have thousands of customers around the world and have developed long-standing business relationships with many of them. We have long-term heavy-duty engine supply agreements with PACCAR and Volvo Trucks North America. We have mid-range supply agreements with PACCAR, as its exclusive engine supplier, as well as with Daimler Trucks North America (formerly Freightliner LLC), Ford and Volkswagen. We also have a supply agreement with Chrysler, primarily relating to sales of our ISB engine for use in Dodge Ram trucks. Collectively, our net sales to these six customers was less than 21 percent of consolidated net sales in 2008 and individually was less than
11
8 percent of consolidated net sales to any single customer. These agreements contain standard purchase and sale agreement terms covering engine and engine parts pricing, quality and delivery commitments, as well as engineering product support obligations. The basic nature of our agreements with OEM customers is that they are long-term price and operations agreements that assure the availability of our products to each customer through the duration of the respective agreements. Agreements with most OEMs contain bilateral termination provisions giving either party the right to terminate in the event of a material breach, change of control or insolvency or bankruptcy of the other party.
Demand in many of our markets has grown rapidly in the last three years resulting in longer lead times in some of our businesses; however, as a result of the recent economic turmoil many of the lead times have decreased significantly. While we have supply agreements with some truck and off-highway equipment OEMs, most of our business is transacted through open purchase orders. These open orders are historically subject to month-to-month releases and are subject to cancellation on reasonable notice without cancellation charges and therefore are not considered firm.
RESEARCH AND DEVELOPMENT EXPENSE
Our research and development program is focused on product improvements, innovations and cost reductions for our customers. We expense research and development expenditures, net of contract reimbursements, when incurred. Research and development expenses, net of contract reimbursements, were $422 million in 2008, $318 million in 2007 and $312 million in 2006. Contract reimbursements were $61 million in 2008, $52 million in 2007 and $40 million in 2006. For 2008 and 2007, 27 percent, or $116 million, and 17 percent, or $55 million, respectively, were directly related to compliance with 2010 EPA emissions standards. For 2006, 3 percent, or $10 million, was related to compliance with 2007 EPA emissions standards.
Product Environmental Compliance
Our engines are subject to extensive statutory and regulatory requirements that directly or indirectly impose standards governing emissions and noise. Our products comply with emissions standards that the EPA, the California Air Resources Board (CARB) and other state regulatory agencies, as well as other regulatory agencies around the world, have established for heavy-duty on-highway diesel and gas engines and off-highway engines produced through 2008. Our ability to comply with these and future emissions standards is an essential element in maintaining our leadership position in regulated markets. We have made and will continue to make, significant capital and research expenditures to comply with these standards. Failure to comply with these standards could result in adverse effects on our future financial results.
EPA Engine Certifications
The current on-highway emissions standards came into effect in the U.S. on January 1, 2007. To meet the 2007 U.S. EPA heavy-duty on-highway emissions standards, Cummins is using cooled Exhaust Gas Recirculation (EGR) technology with particulate matter (PM) filters. Cooled EGR is the same technology that we have used since April 2002 and was selected after reviewing other aftertreatment technologies such as Nitrogen Oxide (NOx) adsorbers and selective catalytic reduction (SCR). Our experience with particulate filters and the availability of ultra-low-sulfur diesel fuel combined to give us the confidence in meeting these tough standards in the U.S. Additionally, while we believe the EGR/PM filter combination was the right solution for 2007 in the U.S. and for certain off-highway
12
applications, we have selected SCR as the right technology to meet on-highway Euro IV and V emissions standards.
New on-highway emission standards will be required in 2010 in the U.S. We announced that we will use an evolution of our proven 2007 technology solution to maintain power and torque with substantial fuel economy improvement and maintenance intervals comparable with today's engines. We will offer a complete lineup of on-highway engines to meet the near-zero emissions standards. Mid-range and heavy-duty engines for EPA 2010 will require NOx aftertreatment. NOx reduction will be achieved by an integrated technology solution comprised of the XPI High Pressure Common Rail fuel system, SCR technology, next-generation cooled EGR, advanced electronic controls, proven air handling and the Cummins Particulate Filter. We are confident that we will meet these standards.
Emissions standards in international markets, including Europe, Japan, Mexico, Australia, Brazil, India and China, are becoming more stringent. We believe that our experience in meeting U.S. emissions standards leaves us well positioned to take advantage of opportunities in these markets as the need for emissions control capability grows.
Federal and California regulations require manufacturers to report failures of emissions-related components to the EPA and CARB when the failure rate reaches a specified level. At higher failure rates, a product recall may be required. In 2008, we submitted seven reports to the EPA relating to four different defects affecting oxidation catalysts, exhaust flex pipes, engine control modules, and vehicle labels. The oxidation catalysts defect necessitated the campaign of approximately 430 engines, and the vehicle label defect resulted in the campaign of 66 vehicles.
Other Environmental Statutes and Regulations
Expenditures for environmental control activities and environmental remediation projects at our facilities in the U.S. have not been a substantial portion of our annual capital outlays and are not expected to be material in 2009. Except as follows, we believe we are in compliance in all material respects with laws and regulations applicable to our plants and operations.
In the U.S., pursuant to notices received from federal and state agencies and/or defendant parties in site environmental contribution actions, we have been identified as a Potentially Responsible Party (PRP) under the Comprehensive Environmental Response, Compensation and Liability Act of 1980, as amended or similar state laws, at approximately 19 waste disposal sites. Based upon our experiences at similar sites we believe that our aggregate future remediation costs will not be significant. We have established accruals that we believe are adequate for our expected future liability with respect to these sites.
In addition, we have four other sites where we are working with governmental authorities on remediation projects. The costs for these remediation projects are not expected to be material.
As of December 31, 2008, we employed approximately 39,800 persons worldwide. Approximately 14,300 of our employees worldwide are represented by various unions under collective bargaining agreements that expire between 2010 and 2014. For discussion of the effects of our restructuring actions on employment, see "Management's Discussion and Analysis of Financial Condition and Results of Operations" and Note 3 to our Consolidated Financial Statements in this Form 10-K.
13
We file annual, quarterly and current reports, proxy statements and other information with the Securities and Exchange Commission (the "SEC"). You may read and copy any document we file with the SEC at the SEC's public reference room at 450 Fifth Street, NW, Washington, DC 20549. Please call the SEC at 1-800-SEC-0330 for information on the public reference room. The SEC maintains an internet site that contains annual, quarterly and current reports, proxy and information statements and other information that issuers (including Cummins) file electronically with the SEC. The SEC's internet site is www.sec.gov.
Our internet site is www.cummins.com. You can access Cummins Investors and Media webpage through our internet site, by clicking on the heading "Investors and Media." We make available, free of charge, on or through our Investors and Media webpage, our proxy statements, annual reports on Form 10-K, quarterly reports on Form 10-Q, current reports on Form 8-K and any amendments to those reports filed or furnished pursuant to the Securities Exchange Act of 1934, as amended, as soon as reasonably practicable after such material is electronically filed with, or furnished to, the SEC.
We also have a Corporate Governance webpage. You can access Cummins Corporate Governance webpage through our internet site, www.cummins.com, by clicking on the heading "Investors and Media," followed by the "Investor Relations" link and then the topic heading of "Governance Documents" within the "Corporate Governance" heading. Cummins code of Conduct and other governance documents are included at this site. Cummins Code of Conduct applies to all employees, regardless of their position or the country in which they work. It also applies to the employees of any entity owned or controlled by Cummins Inc. We will post any amendments to the Code of Conduct and any waivers that are required to be disclosed by the rules of either the SEC or the New York Stock Exchange, Inc. ("NYSE"), on our internet site. The information on Cummins internet site is not incorporated by reference into this report.
In accordance with NYSE Rules, on June 11, 2008, we filed the annual certification by our CEO that, as of the date of the certification, he was unaware of any violation by the company of the NYSE's corporate governance listing standards.
Item 1A. Risk Factors Relating to Our Business
Set forth below and elsewhere in this Annual Report on Form 10-K are some of the principal risks and uncertainties that could cause our actual business results to differ materially from any forward-looking statements contained in this Report. In addition, future results could be materially affected by general industry and market conditions, changes in laws or accounting rules, general U.S. and non-U.S. economic and political conditions, including a global economic slow-down, fluctuation of interest rates or currency exchange rates, terrorism, political unrest or international conflicts, political instability or major health concerns, natural disasters, commodity prices or other disruptions of expected economic and business conditions. These risk factors should be considered in addition to our cautionary comments concerning forward-looking statements in this Report, including statements related to markets for our products and trends in our business that involve a number of risks and uncertainties. Our separate section above, "Cautionary Statements Regarding Forward-Looking Information," should be considered in addition to the following statements.
Our consolidated operating results and financial condition may be adversely impacted by worldwide economic conditions and credit tightening.
The recent global economic crisis has caused a general tightening in the credit markets, lower levels of liquidity, increases in the rates of default and bankruptcy, and extreme volatility in credit, equity and fixed income markets. These conditions may make it difficult or impossible for our customers and suppliers to accurately forecast and plan future business activities, which may cause
14
them to slow or suspend spending on products and services. As our customers face this challenging economic time, they may find it difficult to gain sufficient credit in a timely manner, which could result in an impairment of their ability to place orders with us or to make timely payments to us for previous purchases. If this occurs, our revenue may be reduced, thereby having a negative impact on our results of operations. In addition, we may be forced to increase our allowance for doubtful accounts and our days sales outstanding may increase, which would have a negative impact on our cash position, liquidity and financial condition. As a result of these conditions and depending on the length and impact these conditions have on our individual businesses, we could experience impairments to assets of certain businesses. We cannot predict the timing or the duration of this or any other economic downturn in the economy.
The North American and European automotive industries are in distress and with further deterioration could adversely impact our business.
A number of companies in the global automotive industry are facing severe financial difficulties. In North America, General Motors, Ford, and Chrysler have experienced declining markets. They have announced significant restructuring actions in an effort to improve profitability and some have received Federal financing assistance. The North American automotive manufacturers are also burdened with substantial structural costs, such as pension and healthcare costs, that have impacted their profitability and labor relations and may ultimately result in severe financial difficulty, including bankruptcy. Automakers across Europe and Japan are also experiencing difficulties from a weakened economy and tightening credit markets. Automotive industry conditions have adversely affected our supply base. Lower production levels for some of our key suppliers, increases in certain raw material, commodity and energy costs and the global credit market crisis has resulted in severe financial distress among many companies within the automotive supply base. The continuation of financial distress within the Automotive industry and the supply base and/or the bankruptcy of one or more of the automakers may lead to supplier bankruptcies, commercial disputes, supply chain interruptions, supplier requests for company sponsored capital support, or a collapse of the supply chain.
We have a long standing relationship with Chrysler for the production of diesel engines for their heavy-duty truck series. Chrysler demand for this product decreased in the last twelve months, and accounted for three percent of our consolidated sales in 2008. If Chrysler were to enter into bankruptcy, the collection of receivables would be at risk. If such an event was to occur, and Chrysler is unable to successfully emerge from bankruptcy in the near term, it may be forced to sell some or all of its assets which could include certain production lines including the Dodge Ram which could adversely impact our sales.
Deterioration in the automotive markets could impact the business plan for our light-duty engine products currently under development
In July 2006, we announced plans to develop and manufacture a light-duty diesel engine to be used in a variety of on- and off-highway applications. In July 2007, we entered into an agreement with Chrysler where it would purchase the engine exclusively for use in light-duty pickup trucks and sport utility vehicles. We have development agreements and commercial letters of intent with other automotive and marine customers. We proceeded with the technical development of these engine applications and have made significant investment in a manufacturing facility in Columbus, Indiana.
In January 2009, Chrysler announced that it was delaying introduction of its 1500 Dodge Ram pickup truck with our new light-duty diesel engine until at least 2011. Since that time, we have continued to discuss with Chrysler its commitment to the light-duty diesel engine agreement.
In January 2009, we formally requested that Chrysler provide us with assurances that Chrysler planned to continue to perform its obligations under our agreement for the development of these
15
light-duty diesel engines. Chrysler maintains that its ability to perform its obligations under the agreement remains unchanged despite its recent need for financial assistance from the Federal government. We remain committed to the development of this product line for other existing customers and will continue to discuss the light duty diesel engine program with Chrysler as well as with other potential customers. If significant modifications occur in these programs and we are unable to find alternative customers or applications for these products, we may need to impair our assets which could have an adverse effect on our results of operations and financial condition.
The current deterioration of the credit and capital markets may adversely impact our ability to obtain financing on acceptable terms or obtain funding under our revolving credit facility.
Global financial markets have been experiencing extreme volatility and disruption, and the credit markets have been exceedingly distressed. If credit markets continue to deteriorate, we may be unable to obtain adequate funding under our revolving credit facility because our lending counterparties may be unwilling or unable to meet their funding obligations.
If we are unable to access our revolving credit facility, the instability of financial markets could significantly increase the cost of obtaining additional or alternate funding from the credit markets as many lenders have increased interest rates, enacted tighter lending standards and refused to refinance existing debt. Even if lenders and institutional investors are willing and able to provide adequate funding, interest rates may rise in the future and therefore increase the cost of borrowing we incur on any of our floating rate debt.
Due to these factors, we cannot be certain that funding will be available if needed and to the extent required on acceptable terms. If funding is not available when needed, or is available only on unfavorable terms, it might adversely affect our ability to operate our business which could have a material adverse effect on our revenues and results of operations.
Our manufacturing operations are dependent upon third-party suppliers, making us vulnerable to supply shortages.
Cummins manufactures strategic components internally and through suppliers. We single source approximately 80 to 85 percent of the total types of parts in our product designs. Any delay in our suppliers' deliveries may affect our operations at multiple manufacturing locations, forcing us to seek alternative supply sources to avoid serious disruptions. Delays are caused by factors affecting our suppliers including capacity constraints, labor disputes, economic downturns, availability of credit, the impaired financial condition of a particular supplier, suppliers' allocations to other purchasers, weather emergencies or acts of war or terrorism. Any delay in receiving supplies could impair our ability to deliver products to our customers and, accordingly, could have a material adverse effect on our business, results of operations and financial condition.
Our products are subject to substantial government regulation.
Our engines are subject to extensive statutory and regulatory requirements governing emissions and noise, including standards imposed by the EPA, the European Union, state regulatory agencies, such as the CARB and other regulatory agencies around the world. Developing engines to meet changing government regulatory requirements, with different implementation timelines and emissions requirements, makes developing engines efficiently for multiple markets complicated and could result in substantial additional costs that may be difficult to recover in some markets. In some cases, we may be required to develop new products to comply with new regulations, particularly those relating to air emissions. For example, we were required to develop new engines to comply with stringent emissions standards in the United States (U.S.) by January 1, 2010 and Europe by September 1, 2010. While we
16
were able to meet previous deadlines, our ability to comply with other existing and future regulatory standards will be essential for us to maintain our position in the engine markets we serve.
We have made and will be required to continue to make, significant capital and research expenditures to comply with these regulatory standards. Further, the successful development and introduction of new and enhanced products are subject to risks, such as delays in product development, cost over-runs and unanticipated technical and manufacturing difficulties. In June 2008, four Cummins facilities in Southern Indiana, including our Technical Center, experienced extensive damage caused by flood water resulting from an unusually high amount of rainfall. The Technical Center was closed for a period of time during a critical testing period for new engine development to meet 2010 emission standards. We are insured for business interruption; however, it is possible that we will experience unrecoverable costs as a result of this loss of testing time. Any failure to comply with regulatory standards affecting our products could subject us to fines or penalties and could require us to cease production of any non-compliant engine or to recall any engines produced and sold in violation of the applicable standards. See "Product Environmental Compliance" in "Item 1 Business" for a complete discussion of the environmental laws and regulations that affect our products.
Variability in material and commodity costs could adversely affect our results of operations and financial condition.
Our manufacturing processes are exposed to variability in material and commodity costs. Our businesses establish prices with our customers in accordance with contractual time frames, however, the timing of market price increases may prevent us from passing these additional costs on to our customers through timely pricing actions. Additionally, higher material and commodity costs around the world may offset our efforts to reduce our cost structure. While we customarily enter into financial transactions to address some of these risks, we cannot assure that commodity price fluctuations will not adversely affect our results of operations and financial condition. In addition, while the use of commodity price hedging instruments may provide us with protection from adverse fluctuations in commodity prices, by utilizing these instruments we potentially forego the benefits that might result from favorable fluctuations in price. As a result, higher material and commodity costs, as well as hedging these commodity costs during periods of decreasing prices, both could result in declining margins and could materially impact our results of operations and financial condition.
We are subject to currency exchange rate and other related risks.
We conduct operations in many areas of the world involving transactions denominated in a variety of currencies. We are subject to currency exchange rate risk to the extent that our costs are denominated in currencies other than those in which we earn revenues. In addition, since our financial statements are denominated in U.S. dollars, changes in currency exchange rates between the U.S. dollar and other currencies have had, and will continue to have, an impact on our earnings. While we customarily enter into financial transactions to address these risks, we cannot assure that currency exchange rate fluctuations will not adversely affect our results of operations and financial condition. In addition, while the use of currency hedging instruments may provide us with protection from adverse fluctuations in currency exchange rates, by utilizing these instruments we potentially forego the benefits that might result from favorable fluctuations in currency exchange rates.
We also face risks arising from the imposition of exchange controls and currency devaluations. Exchange controls may limit our ability to convert foreign currencies into U.S. dollars or to remit dividends and other payments by our foreign subsidiaries or businesses located in or conducted within a country imposing controls. Currency devaluations result in a diminished value of funds denominated in the currency of the country instituting the devaluation. Actions of this nature, if they occur or continue for significant periods of time, could have an adverse effect on our results of operations and financial condition in any given period.
17
Deteriorating market conditions could diminish our pension plan asset performance which could adversely impact our equity and our cash flow.
We sponsor both funded and unfunded domestic and foreign defined benefit pension and other retirement plans. Our pension expense and the required contributions to our pension plans are directly affected by the value of plan assets, the projected and actual rates of return on plan assets and the actuarial assumptions we use to measure our defined benefit pension plan obligations, including the discount rate at which future projected and accumulated pension obligations are discounted to a present value. We could experience increased pension expense due to a combination of factors, including the decreased investment performance of pension plan assets, decreases in the discount rate and changes in our assumptions relating to the expected return on plan assets.
The value of investments in our pension trusts have decreased during the recent market decline. As a result we experienced a material change to our Consolidated Balance Sheet which included an increase to Other long-term liabilities and a corresponding decrease in Stockholders' equity through Other comprehensive income. If the market turmoil causes further declines in our pension plan assets, we could continue to experience increased pension expense in future years and changes to Stockholders equity. We may be legally required to make contributions to our U.S pension plans in the future, and these contributions could be material. In addition, if local legal authorities increase the minimum funding requirements for our pension plans outside the U.S., we could be required to contribute more funds, which would negatively affect our cash flow.
We are exposed to political, economic and other risks that arise from operating a multinational business.
Approximately 59 percent of our net sales for 2008 were attributable to customers outside the U.S. Accordingly, our business is subject to the political, economic and other risks that are inherent in operating in numerous countries. These risks include:
As we continue to expand our business globally, our success will depend, in part, on our ability to anticipate and effectively manage these and other risks. We cannot assure that these and other factors will not have a material adverse effect on our international operations or on our business as a whole.
Our products are subject to recall for performance related issues.
We are at risk for product recall costs. Product recall costs are incurred when we decide, either voluntarily or involuntarily, to recall a product through a formal campaign to solicit the return of specific products due to a known or suspected performance issue. Costs typically include the cost of the product, part or component being replaced, customer cost of the recall and labor to remove and replace the defective part or component. When a recall decision is made, we estimate the cost of the recall and record a charge to earnings in that period in accordance with FASB Statement of Financial
18
Accounting Standards (SFAS) No. 5, "Accounting for Contingencies." In making this estimate, judgment is required as to the quantity or volume to be recalled, the total cost of the recall campaign, the ultimate negotiated sharing of the cost between us and the customer and, in some cases, the extent to which the supplier of the part or component will share in the recall cost. As a result, these estimates are subject to change.
We cannot assure that our truck manufacturers and OEM customers will continue to outsource their engine supply needs.
Several of our engine customers, including PACCAR, Navistar, Volvo and Chrysler, are truck manufacturers or OEMs that manufacture engines for some of their own products. Despite their engine manufacturing abilities, these customers have chosen to outsource certain types of engine production to us due to the quality of our engine products, our emissions capability, systems integration, their customers' preferences and in order to reduce costs, eliminate production risks and maintain company focus. However, we cannot assure that these customers will continue to outsource engine production in the future. Increased levels of OEM vertical integration could result from a number of factors, such as shifts in our customers' business strategies, acquisition by a customer of another engine manufacturer, the inability of third-party suppliers to meet product specifications and the emergence of low-cost production opportunities in foreign countries. Any significant reduction in the level of engine production outsourcing from our truck manufacturer or OEM customers could significantly impact our revenues and, accordingly, have a material adverse effect on our business, results of operations and financial condition.
Our operations are subject to extensive environmental laws and regulations.
Our plants and operations are subject to increasingly stringent environmental laws and regulations in all of the countries in which we operate, including laws and regulations governing emissions to air, discharges to water and the generation, handling, storage, transportation, treatment and disposal of waste materials. While we believe that we are in compliance in all material respects with these environmental laws and regulations, we cannot assure that we will not be adversely impacted by costs, liabilities or claims with respect to existing or subsequently acquired operations, under either present laws and regulations or those that may be adopted or imposed in the future. We are also subject to laws requiring the cleanup of contaminated property. If a release of hazardous substances occurs at or from any of our current or former properties or at a landfill or another location where we have disposed of hazardous materials, we may be held liable for the contamination and the amount of such liability could be material.
We face risks through our equity method investments in companies that we do not control.
Our net earnings include significant equity earnings, technical fees and royalty income from unconsolidated subsidiaries. For the year ended December 31, 2008, we recognized $231 million of equity earnings and $22 million of other income from our unconsolidated subsidiaries which comprised almost 34 percent of our net earnings. The majority (80 percent) of our equity earnings comes from our North American distributors, DCEC and CCEC. We have equity interests in several of our North American distributors who distribute the full range of our products and services to customers and end-users. DCEC is located in Xiangfan, China and produces our B, C and L series four to nine liter mechanical engines in addition to full electronic diesel engines. CCEC is located in Chongqing, China and manufactures several models of our heavy-duty and high-horsepower diesel engines, serving primarily the industrial and stationary power markets in China. Our equity investments may not always perform at the levels we have seen in recent years.
19
We face reputational and legal risk from affiliations with joint venture partners.
Several of our joint venture partners are domiciled in areas of the world with laws, rules and business practices that differ from those in the U.S. We strive to select partners who share our values and understand the Cummins reporting and compliance needs as a U.S. domiciled company. We work to ensure that an appropriate business culture exists within the ventures to minimize and mitigate our risk.
We may be adversely impacted by work stoppages and other labor matters.
As of December 31, 2008, we employed approximately 39,800 persons worldwide. Approximately 14,300 of our employees worldwide are represented by various unions under collective bargaining agreements that expire between 2010 and 2014. While we have no reason to believe that we will be impacted by work stoppages and other labor matters, we cannot assure that future issues with our labor unions will be resolved favorably or that we will not encounter future strikes, work stoppages, or other types of conflicts with labor unions or our employees. Any of these factors may have an adverse effect on us or may limit our flexibility in dealing with our workforce. In addition, many of our customers have unionized work forces. Work stoppages or slow-downs experienced by our customers could result in slow-downs or closures at vehicle assembly plants where our engines are installed. If one or more of our customers experience a material work stoppage, it could have a material adverse effect on our business, results of operations and financial condition.
Our business is exposed to risks of product liability claims.
We face an inherent business risk of exposure to product liability claims in the event that our products' failure to perform to specification results, or is alleged to result, in property damage, bodily injury and/or death. We may experience material product liability losses in the future. While we maintain insurance coverage with respect to certain product liability claims, we may not be able to obtain such insurance on acceptable terms in the future, if at all, and any such insurance may not provide adequate coverage against product liability claims. In addition, product liability claims can be expensive to defend and can divert the attention of management and other personnel for significant periods of time, regardless of the ultimate outcome. An unsuccessful defense of a product liability claim could have a material adverse affect on our business, results of operations, financial condition and cash flows. In addition, even if we are successful in defending against a claim relating to our products, claims of this nature could cause our customers to lose confidence in our products and us.
We face significant competition in the markets we serve.
The markets in which we operate are highly competitive. We compete worldwide with a number of other manufacturers and distributors that produce and sell similar products. Our products primarily compete on the basis of price, performance, fuel economy, speed of delivery, quality and customer support. There can be no assurance that our products will be able to compete successfully with the products of these other companies. Any failure by us to compete effectively in the markets we serve could have a material adverse effect on our business, results of operations and financial condition. For a more complete discussion of the competitive environment in which each of our segments operates, see "Operating Segments" in "Item 1 Business."
Our business is affected by the cyclical nature of the markets we serve.
Our financial performance depends, in large part, on varying conditions in the markets and geographies that we serve. Demand in these markets and geographies fluctuates in response to overall economic conditions and is particularly sensitive to changes in interest rate levels. Our sales are also impacted by OEM inventory levels and production schedules and stoppages. Economic downturns in
20
the markets we serve generally result in reductions in sales and pricing of our products, which could reduce future earnings and cash flow. Economic trends can impact our product lines in different ways. For example, our business with Chrysler pickup trucks is a consumer driven market while other product lines serve customers in markets where availability of credit could impact the timing of their purchasing decisions.
Item 1B. Unresolved Staff Comments
None.
Our worldwide manufacturing facilities occupy approximately 15 million square feet, including approximately 8 million square feet in the U.S. Principal manufacturing facilities in the U.S. include our plants in Southern Indiana, Wisconsin, New York, Iowa, South Carolina, Tennessee, Georgia, Ohio, North Carolina and Minnesota.
Manufacturing facilities outside of the U.S. include facilities located in the U.K., Brazil, India, Mexico, France, China, South Africa, Germany, Romania and Australia. In addition, engines and engine components are manufactured by joint ventures or independent licensees at manufacturing plants in the U.K., France, China, India, Japan, Pakistan, South Korea, Turkey and Indonesia.
We are subject to numerous lawsuits and claims arising out of the ordinary course of our business, including actions related to product liability; personal injury; the use and performance of our products; warranty matters; patent, trademark or other intellectual property infringement; contractual liability; the conduct of our business; tax reporting in foreign jurisdictions; distributor termination; workplace safety; and environmental matters. We also have been identified as a potentially responsible party at multiple waste disposal sites under U.S. federal and related state environmental statutes and regulations and may have joint and several liability for any investigation and remediation costs incurred with respect to such sites. Some of these lawsuits and claims involve substantial amounts and some of our environmental proceedings involve potential monetary sanctions that may exceed $100,000. We have denied liability with respect to many of these lawsuits, claims and proceedings and are vigorously defending such lawsuits, claims and proceedings. We carry various forms of commercial, property and casualty, product liability and other forms of insurance; however, such insurance may not be applicable or adequate to cover the costs associated with a judgment against us with respect to these lawsuits, claims and proceedings. We do not believe that these lawsuits are material individually or in the aggregate. While we believe we have also established adequate accruals for our expected future liability with respect to pending lawsuits, claims and proceedings, where the nature and extent of any such liability can be reasonably estimated based upon then presently available information, there can be no assurance that the final resolution of any existing or future lawsuits, claims or proceedings will not have a material adverse effect on our business, results of operation, financial condition or cash flows.
Item 4. Submission of Matters to a Vote of Security Holders
There were no matters submitted to a vote of our security holders during the last quarter of the year ended December 31, 2008.
21
Item 5. Market for Registrant's Common Equity, Related Stockholder Matters and Issuer Purchases of Equity Securities
| |
ISSUER PURCHASES OF EQUITY SECURITIES | ||||||||||||
|---|---|---|---|---|---|---|---|---|---|---|---|---|---|
Period
|
(a) Total Number of Shares Purchased(1) |
(b) Average Price Paid per Share |
(c) Total Number of Shares Purchased as Part of Publicly Announced Plans or Programs |
(d) Maximum Number of Shares that May Yet Be Purchased Under the Plans or Programs(2) |
|||||||||
September 29 - November 2, 2008 |
— | $ | — | — | 67,672 | ||||||||
November 3 - November 30, 2008 |
220,000 | 22.10 | 220,000 | 231,186 | |||||||||
December 1 - December 31, 2008 |
— | — | — | 246,445 | |||||||||
Total |
220,000 | $ | 22.10 | 220,000 | |||||||||
In December 2007, the Board of Directors authorized us to acquire an additional $500 million worth of Cummins common stock. In 2008 we acquired $128 million, leaving $372 million available for purchase under this authorization at December 31, 2008. We announced in February 2009 that we have temporarily suspended our stock repurchase program to conserve cash.
During the fourth quarter of 2008, we did not repurchase any shares from employees in connection with the Key Employee Stock Investment Plan which allows certain employees, other than officers, to purchase shares of common stock on an installment basis up to an established credit limit. Loans are issued for five-year terms at a fixed interest rate established at the date of purchase and may be refinanced after its initial five-year period for an additional five-year period. Participants must hold shares for a minimum of six months from date of purchase and after shares are sold must wait six months before another share purchase may be made. There is no maximum amount of shares that we may purchase under this plan.
During the fourth quarter of 2008, we issued 1,665 shares of common stock as compensation to our non-employee directors, all of whom are accredited investors. These shares were not registered under the Securities Act of 1933 (the "Securities Act") pursuant to the exemption from the registration provided by Section 4(2) of the Securities Act.
According to our bylaws, we are not subject to the provisions of the Indiana Control Share Act. However, we are governed by certain other laws of the State of Indiana applicable to transactions involving a potential change of control of the company.
22
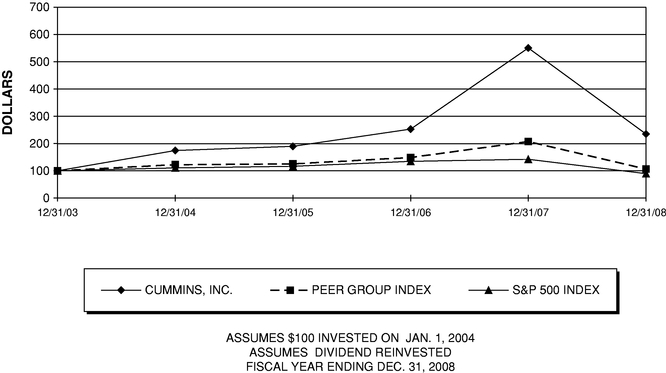
The following Performance Graph and related information shall not be deemed "soliciting material" or to be "filed" with the Securities and Exchange Commission, nor shall such information be incorporated by reference into any future filing under the Securities Act of 1933 or Securities Exchange Act of 1934, each as amended, except to the extent that the Company specifically incorporates it by reference into such filing.
The following graph compares the cumulative total shareholder return on Cummins Inc.'s Common Stock for the last five fiscal years with the cumulative total return on the S&P 500 Index and an index of peer companies selected by us. For the year ended December 31, 2008, our peer group included ArvinMeritor Inc., Caterpillar, Inc., Deere & Company, Eaton Corporation, Ingersoll-Rand Company Ltd., Navistar International Corporation and Paccar Inc. Dana Holding Company was removed from our peer group as they were involved in a chapter 11 bankruptcy filing as of December 31, 2008. Each of the three measures of cumulative total return assumes reinvestment of dividends. The comparisons in this table are required by the SEC and are not intended to forecast or be indicative of possible future performance of our stock.
COMPARISON OF 5-YEAR CUMULATIVE TOTAL RETURN
AMONG CUMMINS, INC.,
S&P 500 INDEX AND PEER GROUP INDEX
23
Item 6. Selected Financial Data
The selected financial information presented below for the five year period ended December 31, 2008, was derived from our Consolidated Financial Statements. This information should be read in conjunction with the Consolidated Financial Statements and related notes and Management's Discussion and Analysis of Financial Condition and Results of Operations.
| |
2008 | 2007 | 2006 | 2005 | 2004 | ||||||||||||
|---|---|---|---|---|---|---|---|---|---|---|---|---|---|---|---|---|---|
| |
in millions, except per share amounts |
||||||||||||||||
For the years ended December 31, |
|||||||||||||||||
Net sales |
$ | 14,342 | $ | 13,048 | $ | 11,362 | $ | 9,918 | $ | 8,438 | |||||||
U.S. percentage of sales |
41 | % | 46 | % | 50 | % | 49 | % | 52 | % | |||||||
Non-U.S. percentage of sales |
59 | % | 54 | % | 50 | % | 51 | % | 48 | % | |||||||
Gross margin |
2,940 | 2,556 | 2,465 | 2,044 | 1,560 | ||||||||||||
Research, development and engineering expenses |
422 | 329 | 321 | 278 | 241 | ||||||||||||
Equity, royalty and interest income from investees |
253 | 205 | 140 | 131 | 120 | ||||||||||||
Interest expense |
42 | 58 | 96 | 109 | 111 | ||||||||||||
Net income |
755 | 739 | 715 | 550 | 350 | ||||||||||||
Net earnings per share(1): |
|||||||||||||||||
Basic |
$ | 3.87 | $ | 3.72 | $ | 3.76 | $ | 3.11 | $ | 2.07 | |||||||
Diluted |
3.84 | 3.70 | 3.55 | 2.75 | 1.85 | ||||||||||||
Dividends declared per share |
0.60 | 0.43 | 0.33 | 0.30 | 0.30 | ||||||||||||
Cash flows from operations |
$ | 987 | $ | 810 | $ | 840 | $ | 760 | $ | 614 | |||||||
Capital expenditures |
543 | 353 | 249 | 186 | 151 | ||||||||||||
At December 31, |
|||||||||||||||||
Cash and cash equivalents |
$ | 426 | $ | 577 | $ | 840 | $ | 779 | $ | 611 | |||||||
Total assets |
8,519 | 8,195 | 7,465 | 6,885 | 6,510 | ||||||||||||
Long-term debt |
629 | 555 | 647 | 1,213 | 1,299 | ||||||||||||
Shareholders' equity(2) |
3,230 | 3,409 | 2,802 | 1,864 | 1,401 | ||||||||||||
24
Item 7. Management's Discussion and Analysis of Financial Condition and Results of Operations
Cummins Inc. and its consolidated subsidiaries are hereinafter sometimes referred to as "Cummins," "the Company," "the registrant," "we," "our," or "us."
The following Management's Discussion and Analysis of Financial Condition and Results of Operations ("MD&A") was prepared to provide the reader with a view and perspective of our businesses through the eyes of management and should be read in conjunction with our Consolidated Financial Statements and the accompanying notes to those financial statements. Our MD&A is presented in the following sections:
25
EXECUTIVE SUMMARY AND FINANCIAL HIGHLIGHTS
We are a leading global power provider that designs, manufactures, distributes and services diesel and natural gas engines, electric power generation systems and engine-related component products, including filtration and exhaust aftertreatment, fuel systems, controls and air handling systems. We sell our products to Original Equipment Manufacturers (OEMs), distributors and other customers worldwide. We have long-standing relationships with many of the leading manufacturers in the markets we serve, including PACCAR Inc., International Truck and Engine Corporation (Navistar International Corporation), Chrysler LLC, Volvo AB, Daimler Trucks North America (formerly Freightliner), Ford Motor Company, Case New Holland, Komatsu, and Volkswagen. We serve our customers through a network of more than 500 company-owned and independent distributor locations and approximately 5,200 dealer locations in more than 190 countries and territories.
Our reportable operating segments consist of the following: Engine, Power Generation, Components and Distribution. This reporting structure is organized according to the products and markets each segment serves. This type of reporting structure allows management to focus its efforts on providing enhanced service to a wide range of customers. The Engine segment produces engines and parts for sale to customers in on-highway and various industrial markets. The engines are used in trucks of all sizes, buses and recreational vehicles, as well as various industrial applications including construction, mining, agriculture, marine, oil and gas, rail and military. The Power Generation segment is an integrated provider of power systems which sells engines, generator sets and alternators. The Components segment includes sales of filtration products, exhaust aftertreatment systems, turbochargers and fuel systems. The Distribution segment includes wholly-owned and partially-owned distributorships engaged in wholesaling engines, generator sets, and service parts, as well as performing service and repair activities on our products and maintaining relationships with various OEMs throughout the world.
Our financial performance depends, in large part, on varying conditions in the markets we serve, particularly the on-highway, construction and general industrial markets. Demand in these markets tends to fluctuate in response to overall economic conditions and is particularly sensitive to changes in interest rate levels and our customers' access to credit. Our sales may also be impacted by OEM inventory levels and production schedules and stoppages. Economic downturns in markets we serve generally result in reductions in sales and pricing of our products. As a worldwide business, our operations are also affected by political, economic and regulatory matters, including environmental and emissions standards, in the countries we serve. However, our geographic diversity and broad product and service offerings have helped limit the impact of any one industry or customer and the economy of any single country on our consolidated results. In 2008, softness in the pick-up truck, recreational vehicle, and recreational marine markets worsened and evidence of a downturn in the United States (U.S.) and European economies and softening in global markets became more evident, particularly in the fourth quarter when we saw severe declines in the truck and construction businesses. Despite these unfavorable conditions, we reported increased net sales and net income during 2008 compared to 2007. Approximately 54 percent of our annual 2007 sales came from countries other than the U.S. and that trend grew to 59 percent for the year ended December 31, 2008, which helped to mitigate some of our exposure in the U.S. economy. The diversity of our business portfolio has contributed to the significant organic growth we have experienced over the past several years and continued into 2008 despite more difficult economic conditions.
We continued our strong performance of the past four years into 2008 with a fifth straight year of record net sales and net income. Net income was $755 million, or $3.84 per diluted share, on sales of $14.3 billion, compared to 2007 net income of $739 million, or $3.70 per diluted share, on sales of $13.0 billion. The income improvement was driven by a 10 percent increase in net sales and a 15 percent increase in gross margin, as we benefited from improved pricing and higher demand across most of our businesses, increased market share in a number of markets and focused cost reduction
26
efforts. However, as the result of the deepening global credit crisis that began impacting many of our markets in the fourth quarter of 2008 and the bleak global economic outlook for 2009, we implemented targeted restructuring actions in the fourth quarter of 2008 at a pretax cost of $37 million ($26 million after-tax), or $0.13 per share. We are also taking additional restructuring actions in early 2009 to adjust for continued weakening markets and decaying economic conditions affecting most of our markets. For a detailed discussion of restructuring see "Restructuring Charges" and Note 3 to the Consolidated Financial Statements.
| |
|
|
|
Favorable/ (Unfavorable) | |||||||||||||||||||
|---|---|---|---|---|---|---|---|---|---|---|---|---|---|---|---|---|---|---|---|---|---|---|---|
| |
Years ended December 31, | 2008 vs. 2007 | 2007 vs. 2006 | ||||||||||||||||||||
| Dollars in millions |
2008 | 2007 | 2006 | Amount | Percent | Amount | Percent | ||||||||||||||||
Net sales |
$ | 14,342 | $ | 13,048 | $ | 11,362 | $ | 1,294 | 10 | % | $ | 1,686 | 15 | % | |||||||||
Cost of sales |
11,402 | 10,492 | 8,897 | (910 | ) | (9 | )% | (1,595 | ) | (18 | )% | ||||||||||||
Gross margin |
2,940 | 2,556 | 2,465 | 384 | 15 | % | 91 | 4 | % | ||||||||||||||
Operating expenses and income |
|||||||||||||||||||||||
Selling, general and administrative expenses |
1,450 | 1,296 | 1,153 | (154 | ) | (12 | )% | (143 | ) | (12 | )% | ||||||||||||
Research, development and engineering expenses |
422 | 329 | 321 | (93 | ) | (28 | )% | (8 | ) | (2 | )% | ||||||||||||
Equity, royalty and interest income from investees |
253 | 205 | 140 | 48 | 23 | % | 65 | 46 | % | ||||||||||||||
Restructuring charges |
37 | — | — | (37 | ) | NM | — | — | % | ||||||||||||||
Other operating (expense) income, net |
(12 | ) | 22 | — | (34 | ) | NM | 22 | NM | ||||||||||||||
Operating income |
1,272 | 1,158 | 1,131 | 114 | 10 | % | 27 | 2 | % | ||||||||||||||
Interest income |
18 | 36 | 47 | (18 | ) | (50 | )% | (11 | ) | (23 | )% | ||||||||||||
Interest expense |
42 | 58 | 96 | 16 | 28 | % | 38 | 40 | % | ||||||||||||||
Other (expense) income, net |
(70 | ) | 33 | 1 | (103 | ) | NM | 32 | NM | ||||||||||||||
Income before income taxes and minority interests |
1,178 | 1,169 | 1,083 | 9 | 1 | % | 86 | 8 | % | ||||||||||||||
Income tax expense |
360 | 381 | 324 | 21 | 6 | % | (57 | ) | (18 | )% | |||||||||||||
Minority interests in income of consolidated subsidiaries |
63 | 49 | 44 | (14 | ) | (29 | )% | (5 | ) | (11 | )% | ||||||||||||
Net income |
$ | 755 | $ | 739 | $ | 715 | $ | 16 | 2 | % | $ | 24 | 3 | % | |||||||||
Diluted earnings per share |
$ | 3.84 | $ | 3.70 | $ | 3.55 | $ | 0.14 | 4 | % | $ | 0.15 | 4 | % | |||||||||
27
2008 vs. 2007
Net Sales
Net sales increased in all segments due to the following drivers.
These increases in net sales were partially offset by softening in the U.S. economy which has resulted in a significant reduction in demand in light-duty automotive and recreational markets for engines as well as decreased demand for consumer power generation products and a significant reduction in most other markets in the fourth quarter of 2008 as the result of the economic recession.
A more detailed discussion of sales by segment is presented in the Operating Segments Results section.
Gross Margin
Significant drivers of the change in gross margins were as follows:
| |
2008 vs. 2007 Increase (Decrease) |
|||
|---|---|---|---|---|
| |
in millions |
|||
Price |
$ | 402 | ||
Volume/Mix |
233 | |||
Production costs |
47 | |||
Currency |
47 | |||
Warranty expense |
(185 | ) | ||
Material Costs |
(173 | ) | ||
Other |
13 | |||
Total |
$ | 384 | ||
Gross margin increased by $384 million, and as a percentage of sales increased by 0.9 percentage points. Benefits from increased pricing and a more favorable volume/mix of products sold were partially offset by higher material costs reflecting the increase in commodity prices during the year and higher warranty expense. Our warranty expense reflects favorable warranty experience for some engine products and our provision related to sales in 2008 was 2.9 percent of sales, down from 3.1 percent in 2007. This result was more than offset by negative trends primarily in certain mid-range engine products launched in 2007 for which we recorded additional warranty liability of approximately $117 million in the fourth quarter of 2008.
A more detailed discussion of margin by segment is presented in the "Operating Segments Results" section.
28
Selling, General and Administrative Expenses
Selling, general and administrative expenses increased primarily due to increased consulting expenses of $36 million, increased compensation and related expenses of approximately $34 million, and the acquisition of a majority ownership interest in three previously independent North American distributors. Increased headcount and compensation and related expenses included salaries, variable compensation and fringe benefits across the business in support of higher volumes and business growth. Overall selling, general and administrative expenses as a percentage of sales increased to 10.1 percent in 2008 from 9.9 percent in 2007.
Research, Development and Engineering Expenses
Research, development and engineering expenses increased significantly, primarily due to higher spending on development programs for future products including increased headcount, compensation and related expenses. Compensation and related expenses include salaries, variable compensation and fringe benefits. Fluctuations in other miscellaneous research and development expenses were not significant individually or in the aggregate. Overall, research, development and engineering expenses as a percentage of sales increased to 2.9 percent in 2008 from 2.5 percent in 2007.
Equity, Royalty and Interest Income from Investees
Equity, royalty and interest income from investees increased significantly, primarily due to increases in income from North American distributors of $17 million, Dongfeng Cummins Engine Company, Ltd. (DCEC) of $14 million, increased royalty and interest income of $9 million and increased income from Chongqing Cummins Engine Company Limited (CCEC) of $8 million. Shanghai Fleetguard Filter Co., Ltd also experienced an increase of $2 million. These increases were slightly offset by decreases from Tata Cummins Ltd. (TCL) of $6 million and Cummins MerCruiser Diesel Marine LLC (MerCruiser) of $8 million. North American distributors increased primarily due to income from a joint venture which we formed in the fourth quarter of 2007. DCEC sales increased largely due to prebuy activity in the first half of 2008 prior to a mid-year emissions change. CCEC increased primarily due to increased sales volumes. TCL experienced decreased sales volumes for the year while MerCruiser profits declined due to a significant decline in the recreational marine market and increased research, development and engineering expenses.
Other Operating (Expense) Income, Net
| |
Years ended December 31, |
||||||
|---|---|---|---|---|---|---|---|
| |
2008 | 2007 | |||||
| |
in millions |
||||||
Other operating (expense) income: |
|||||||
Royalty income |
$ | 12 | $ | 7 | |||
Gain on sale of fixed assets(1) |
5 | 22 | |||||
Flood damage expenses |
(5 | ) | — | ||||
Royalty expense |
(10 | ) | (4 | ) | |||
Amortization of other intangibles(2) |
(13 | ) | (1 | ) | |||
Other, net |
(1 | ) | (2 | ) | |||
Total other operating (expense) income, net |
$ | (12 | ) | $ | 22 | ||
29
Interest Income
Interest income decreased primarily due to lower average cash balances in 2008 compared to 2007.
Interest Expense
Interest expense decreased primarily due to declining short-term interest rates and a benefit from our interest rate swap.
Other (Expense) Income, Net
| |
Years ended December 31, |
||||||
|---|---|---|---|---|---|---|---|
| |
2008 | 2007 | |||||
| |
in millions |
||||||
Other (expense) income: |
|||||||
Change in cash surrender value of corporate owned life insurance(1) |
$ | (36 | ) | $ | — | ||
Bank charges |
(12 | ) | (12 | ) | |||
Foreign currency (losses) gains(2) |
(46 | ) | 28 | ||||
Other, net |
24 | 17 | |||||
Total other (expense) income, net |
$ | (70 | ) | $ | 33 | ||
Income Tax Expense
Our income tax rates are generally less than the 35 percent U.S. income tax rate primarily because of lower taxes on foreign earnings and research tax credits. Our effective tax rate for 2008 was 30.6 percent compared to 32.6 percent for 2007. The decrease is primarily due to greater foreign earnings in 2008, which are subject to lower tax rates. Our 2008 income tax provision also includes a $10 million (0.8 percent) reduction in the fourth quarter due to the legislative reinstatement of the U.S. research tax credit.
We expect our 2009 effective tax rate to be 31 percent excluding any discrete items that may arise.
Minority Interests in Income of Consolidated Subsidiaries
Minority interests in income of consolidated subsidiaries eliminates the income or loss attributable to non-Cummins ownership interests in our consolidated entities. Minority interests in income of consolidated subsidiaries increased primarily due to higher income at our consolidated subsidiary in India. Cummins India Limited's (CIL's), a 51 percent owned subsidiary, minority interest increased $10 million due to the creation of a new export business in 2008 and favorable price adjustments for high horsepower products. There were no other individual fluctuations in the subsidiaries that were significant.
30
Net Income and Diluted Earnings Per Share
Net income and diluted earnings per share increased primarily due to higher volumes, improved margins, higher equity income and a lower effective tax rate. These increases were partially offset by warranty expense, restructuring charges and investment losses primarily occurring during the fourth quarter of 2008, in addition to unfavorable foreign currency effects.
Outlook
Near-Term:
We expect sales and profits to be lower in 2009 given the economic outlook. Our operating results in 2009 will depend on how the current global economic conditions impact the markets we serve. Forecasting for 2009 is a significant challenge with these uncertain market conditions. Many of the markets we serve are slowing significantly as a result of the credit crisis and softening global economic environment and we expect 2009 sales will be down significantly from 2008 levels. In response to anticipated market conditions we executed voluntary and involuntary separation actions in December of 2008 and January of 2009. We expect to continue to focus on cost reductions and scaling production to meet current demand. If uncertainties in the credit and capital markets continue, the overall impact on our customers as well as end user demand for our products could have a significant adverse impact on our near-term results. In light of current economic conditions, if conditions continue to worsen in 2009, it is reasonably possible that we may be required to incur impairment charges on certain assets as we decrease production or close certain manufacturing facilities in response to decreasing demand. Impairments could have a material impact on our results of operations and financial position. At this time we cannot estimate these potential impairment charges.
Long-Term:
While there is uncertainty in the near-term market as a result of the current economic conditions, we continue to be optimistic that opportunities for long-term growth and profitability will continue in the future.
2007 vs. 2006
Net Sales
Net sales increased in all segments due to the following drivers.
These increases were partially offset by:
31
A more detailed discussion of sales by segment is presented in the Operating Segment Results section.
Gross Margin
Significant drivers of the change in gross margin were as follows:
| |
2007 vs. 2006 Increase (Decrease) |
|||
|---|---|---|---|---|
| |
in millions |
|||
Price |
$ | 516 | ||
Volume/Mix |
158 | |||
Production costs |
(419 | ) | ||
Warranty expense |
(87 | ) | ||
Deconsolidation of a joint venture |
(65 | ) | ||
Other |
(12 | ) | ||
Total |
$ | 91 | ||
Gross margin as a percentage of sales declined by 2.1 percentage points as margin percentages declined in three of our segments. The provision for warranties issued for the year was 3.1 percent of consolidated sales, compared to 2.8 percent for 2006.
A more detailed discussion of margin by segment is presented in our Operating Segment Results section.
Selling, General and Administrative Expenses
Selling, general and administrative expenses increased primarily due to increased compensation and related expenses of approximately $116 million in support of higher volumes and business growth, and increased consulting fees and other outside services of $32 million. Increased headcount, compensation and related expenses included salaries, variable compensation and fringe benefits across the business in support of higher volumes and business growth. Overall selling, general and administrative expenses as a percentage of sales declined to 9.9 percent in 2007 from 10.1 percent in 2006.
Research, Development and Engineering Expenses
Research, development and engineering expenses increased primarily due to higher spending on new product development and critical technologies for 2010 and beyond including increased headcount, compensation and related expenses to support business growth. Compensation and related expenses include salaries, variable compensation, and fringe benefits. Fluctuations in other miscellaneous research, development and engineering expenses were not significant individually or in the aggregate. Overall, research, development and engineering expenses declined to 2.5 percent in 2007 from 2.8 percent in 2006.
Equity, Royalty and Interest Income from Investees
Equity, royalty and interest income from investees increased significantly, primarily due to improved income from North American distributors of $35 million, DCEC of $22 million, CCEC of $7 million and MerCruiser of $5 million, while the other joint ventures had slight increases. North American distributors increased primarily as the result of organic growth, acquisitions and the deconsolidation of a North American joint venture in 2007.
32
Other Operating (Expense) Income, Net
| |
Years ended December 31, |
||||||
|---|---|---|---|---|---|---|---|
| |
2007 | 2006 | |||||
| |
in millions |
||||||
Other operating (expense) income: |
|||||||
Gain on sale of fixed assets(1) |
$ | 22 | $ | 4 | |||
Royalty income |
7 | 3 | |||||
Amortization of other intangibles |
(1 | ) | 1 | ||||
Royalty expense |
(4 | ) | (3 | ) | |||
Other, net |
(2 | ) | (5 | ) | |||
Total other operating (expense) income, net |
$ | 22 | $ | — | |||
Interest Income
Interest income decreased primarily due to lower average cash balances in 2007 compared to 2006.
Interest Expense
Interest expense decreased primarily due to a decline of $137 million in debt balances, partially offset by higher interest rates.
Other (Expense) Income, Net
| |
Years ended December 31, |
||||||
|---|---|---|---|---|---|---|---|
| |
2007 | 2006 | |||||
| |
in millions |
||||||
Other (expense) income: |
|||||||
Loss on early extinguishment of debt(1) |
$ | — | $ | (12 | ) | ||
Bank charges |
(12 | ) | (14 | ) | |||
Foreign currency (losses) gains(2) |
28 | 11 | |||||
Other, net |
17 | 16 | |||||
Total other (expense) income, net |
$ | 33 | $ | 1 | |||
Income Tax Expense
Our income tax rates have been less than the 35 percent U.S. income tax rate primarily because of lower taxes on foreign income and research tax credits. Export tax benefits also reduced our tax rate prior to 2007.
Our effective tax rate for 2007 was 32.6 percent compared to 29.9 percent for 2006. The increase is in part due to the full repeal after 2006 of U.S. export tax benefits which reduced our 2006 tax rate by
33
1.4 percent. Our income tax provision for 2006 also included a $28 million (2.6 percent) benefit for the favorable resolution of tax uncertainties related to prior years offset by a $12 million (1.1 percent) increase for the effect of new Indiana tax legislation.
Minority Interests in Income of Consolidated Subsidiaries
Minority interests are primarily attributable to CIL, a 51 percent owned subsidiary and Wuxi Holset Engineering Co. Ltd. (Wuxi), a 55 percent owned subsidiary. These two subsidiaries accounted for over 80 percent of the total minority interest in 2007. These increases were partially offset by the deconsolidation of Cummins Eastern Canada LLP (CEC), a 51 percent owned subsidiary, on January 1, 2007. The remainder of the consolidated partially-owned subsidiaries had a combination of immaterial increases and decreases in income.
Net Income and Diluted Earnings Per Share
Net income and diluted earnings per share increased primarily due to higher volumes, significant improvement in equity earnings, lower interest expense and favorable foreign currency effects. These increases were partially offset by higher fixed costs to support growth and a higher effective tax rate.
We have executed restructuring actions primarily in the form of voluntary and involuntary separation programs in the fourth quarter of 2008. These actions were in response to the continued deterioration we saw in our U.S. businesses and most key markets around the world in the second half of 2008, as well as a reduction in orders in most U.S. and global markets for 2009. We reduced our worldwide professional workforce by approximately 650 employees, or 4.5 percent. We offered a voluntary retirement package to certain active professional employees in the U.S. based on a clearly defined set of criteria. We also took voluntary and involuntary actions which included approximately 800 hourly employees, the majority of which received severance benefits. The compensation packages contained salary and continuation of benefits, including health care, life insurance and outplacement services. The voluntary retirement package was accepted by approximately 150 employees. The remaining professional reductions of 500 employees were involuntary. The expenses recorded during the year ended December 31, 2008, included severance costs related to both voluntary and involuntary terminations. During 2008, we incurred a pretax charge related to the professional and hourly restructuring initiatives of approximately $37 million.
Employee termination and severance costs were recorded based on approved plans developed by the businesses and corporate management which specified positions to be eliminated, benefits to be paid under existing severance plans or statutory requirements and the expected timetable for completion of the plan. Estimates of restructuring were made based on information available at the time charges were recorded. Due to the inherent uncertainty involved, actual amounts paid for such activities may differ from amounts initially recorded and we may need to revise previous estimates.
At December 31, 2008, of the approximately 1,450 employees to be affected by this plan, 1,250 had been terminated. If the restructuring actions are successfully implemented, we expect such actions to yield approximately $45 million to $50 million in annual savings. Approximately 41 percent of the savings from the restructuring actions will be realized in cost of sales, 44 percent in selling, general and administrative expenses, and 15 percent in research, development and engineering expenses. We expect all of the pretax charge to be paid in cash which will be funded with cash generated from operations.
34
The table below summarizes the balance of accrued restructuring expenses, which is included in the balance of Other accrued expenses in the consolidated balance sheets for the year ended December 31, 2008:
| |
Total Expenses | Payments | Accrued Balance at December 31, 2008 | |||||||
|---|---|---|---|---|---|---|---|---|---|---|
| |
in millions |
|||||||||
Restructuring charges(1) |
$ | 37 | $ | 3 | $ | 34 | ||||
We do not include restructuring charges in the segment results. The pretax impact of allocating restructuring charges for the year ended December 31, 2008, would have been as follows:
| |
in millions | |||
|---|---|---|---|---|
Engine |
$ | 15 | ||
Power Generation |
3 | |||
Components |
14 | |||
Distribution |
2 | |||
Corporate |
3 | |||
Total restructuring charges |
$ | 37 | ||
In early 2009, we announced additional reductions in our workforce, through both voluntary and involuntary actions, of approximately 1,300 employees by March 1, 2009, including 800 salaried employees and 500 hourly employees. In light of current economic conditions, if conditions continue to worsen in 2009, it is reasonably possible that we may be required to take further actions, including workforce reductions and impairments on certain assets as we decrease production or close certain manufacturing facilities in response to decreasing demand. These actions could have a material impact on our results of operations and financial position. We expect our first quarter restructuring charge to exceed the amount taken in 2008.
Our reportable operating segments consist of the following: Engine, Power Generation, Components, and Distribution. This reporting structure is organized according to the products and markets each segment serves. This type of reporting structure allows management to focus its efforts on providing enhanced service to a wide range of customers. The Engine segment produces engines and parts for sale to customers in on-highway and various industrial markets. The engines are used in trucks of all sizes, buses and RVs, as well as various industrial applications including construction, mining, agriculture, marine, oil and gas, rail and military. The Power Generation segment is an integrated provider of power systems which sells engines, generator sets and alternators. The Components segment includes sales of filtration products, exhaust and aftertreatment systems, turbochargers and fuel systems. The Distribution segment includes wholly-owned and partially-owned distributorships engaged in wholesaling engines, generator sets, and service parts, as well as performing service and repair activities on our products and maintaining relationships with various OEMs.
We use segment EBIT (defined as earnings before interest expense, taxes and minority interests) as a primary basis for the chief operating decision-maker to evaluate the performance of each of our operating segments. Segment amounts exclude certain expenses not specifically identifiable to segments.
The accounting policies of our operating segments are the same as those applied in the Consolidated Financial Statements. We prepared the financial results of our operating segments on a basis that is consistent with the manner in which we internally disaggregate financial information to
35
assist in making internal operating decisions. We have allocated certain common costs and expenses, primarily corporate functions, among segments differently than we would for stand-alone financial information prepared in accordance with accounting principles generally accepted in the United States of America (GAAP). These include certain costs and expenses of shared services, such as information technology, human resources, legal and finance. We also do not allocate debt-related items, actuarial gains or losses, prior service costs or credits, restructuring charges, investment gains or losses, flood damage, or income taxes to individual segments. Segment EBIT may not be consistent with measures used by other companies.
Financial data for the Engine segment was as follows:
| |
|
|
|
Favorable/(Unfavorable) | |||||||||||||||||||
|---|---|---|---|---|---|---|---|---|---|---|---|---|---|---|---|---|---|---|---|---|---|---|---|
| |
Years ended December 31, | 2008 vs. 2007 | 2007 vs. 2006 | ||||||||||||||||||||
| Dollars in millions |
2008 | 2007 | 2006 | Amount | Percent | Amount | Percent | ||||||||||||||||
External sales |
$ | 7,432 | $ | 7,129 | $ | 6,640 | $ | 303 | 4 | % | $ | 489 | 7 | % | |||||||||
Intersegment sales |
1,378 | 1,053 | 871 | 325 | 31 | % | 182 | 21 | % | ||||||||||||||
Net sales |
8,810 | 8,182 | 7,511 | 628 | 8 | % | 671 | 9 | % | ||||||||||||||
Depreciation and amortization |
180 | 176 | 192 | (4 | ) | (2 | )% | 16 | 8 | % | |||||||||||||
Research, development and engineering expenses |
286 | 222 | 225 | (64 | ) | (29 | )% | 3 | 1 | % | |||||||||||||
Equity, royalty and interest income from investees |
99 | 92 | 67 | 7 | 8 | % | 25 | 37 | % | ||||||||||||||
Interest income |
10 | 26 | 36 | (16 | ) | (62 | )% | (10 | ) | (28 | )% | ||||||||||||
Segment EBIT |
535 | 589 | 733 | (54 | ) | (9 | )% | (144 | ) | (20 | )% | ||||||||||||
Segment EBIT as a percentage of net sales |
6.1 |
% |
7.2 |
% |
9.8 |
% |
(1.1) percentage points |
(2.6) percentage points |
|||||||||||||||
A summary and discussion of Engine segment net sales by market follows:
| |
|
|
|
Favorable/(Unfavorable) | |||||||||||||||||||
|---|---|---|---|---|---|---|---|---|---|---|---|---|---|---|---|---|---|---|---|---|---|---|---|
| |
Years ended December 31, | 2008 vs. 2007 | 2007 vs. 2006 | ||||||||||||||||||||
| Dollars in millions |
2008 | 2007 | 2006 | Amount | Percent | Amount | Percent | ||||||||||||||||
Heavy-duty truck |
$ | 2,308 | $ | 1,948 | $ | 2,498 | $ | 360 | 18 | % | $ | (550 | ) | (22 | )% | ||||||||
Medium-duty truck and bus |
1,550 | 1,284 | 971 | 266 | 21 | % | 313 | 32 | % | ||||||||||||||
Light-duty automotive and RV |
804 | 1,340 | 1,261 | (536 | ) | (40 | )% | 79 | 6 | % | |||||||||||||
Total on-highway |
4,662 | 4,572 | 4,730 | 90 | 2 | % | (158 | ) | (3 | )% | |||||||||||||
Industrial |
3,029 | 2,676 | 2,063 | 353 | 13 | % | 613 | 30 | % | ||||||||||||||
Stationary power |
1,119 | 934 | 718 | 185 | 20 | % | 216 | 30 | % | ||||||||||||||
Total net sales |
$ | 8,810 | $ | 8,182 | $ | 7,511 | $ | 628 | 8 | % | $ | 671 | 9 | % | |||||||||
36
A summary of unit shipments by engine classification (including unit shipments to Power Generation) follows:
| |
|
|
|
Favorable/ (Unfavorable) | |||||||||||||||||||
|---|---|---|---|---|---|---|---|---|---|---|---|---|---|---|---|---|---|---|---|---|---|---|---|
| |
Years ended December 31, | 2008 vs. 2007 | 2007 vs. 2006 | ||||||||||||||||||||
| |
2008 | 2007 | 2006 | Amount | Percent | Amount | Percent | ||||||||||||||||
Mid-range |
418,300 | 486,800 | 459,900 | (68,500 | ) | (14 | )% | 26,900 | 6 | % | |||||||||||||
Heavy-duty |
108,300 | 91,400 | 123,400 | 16,900 | 18 | % | (32,000 | ) | (26 | )% | |||||||||||||
High-horsepower |
20,600 | 18,500 | 16,300 | 2,100 | 11 | % | 2,200 | 13 | % | ||||||||||||||
Total unit shipments |
547,200 | 596,700 | 599,600 | (49,500 | ) | (8 | )% | (2,900 | ) | — | % | ||||||||||||
2008 vs. 2007
Net Sales
Engine segment sales increased primarily due to the following drivers.
These increases were partially offset by a 50 percent decline in units sold to Chrysler. This decline was due to the deteriorating demand for light duty trucks in North America as the result of the softening U.S. economy and concerns over fuel prices earlier in the year.
Total on-highway-related sales were 53 percent of total engine segment sales in 2008, compared to 56 percent in 2007.
Segment EBIT
Engine segment EBIT decreased primarily due to lower engine volumes in the mid-range on-highway truck markets, increased warranty expense and increased material cost partially offset by improved industrial engine and parts pricing and more favorable sales mix in the on-highway markets. Gross margin increased $73 million, or 6 percent; however, gross margin percentage decreased by 0.3 percentage points. Gross margin was higher due to price improvements, primarily in industrial engines, and favorable product mix. These increases were partially offset by increased warranty expense
37
due to the increased mix of newer emissions-driven products and higher repair costs on certain engines, in addition to increased material prices due to higher commodity prices during the year. Selling, general and administrative expenses increased $30 million, or 5 percent, and remained relatively flat as a percentage of sales for the year. The increase in selling, general and administrative expenses was primarily due to higher payroll costs as the result of salary increases and an increase in the number of segment employees during the year. Research, development and engineering expenses increased $64 million, or 29 percent, and increased 0.5 percentage points, as a percentage of sales for the year, as compared to the prior year. The increase in research, development and engineering expenses was the result of increased spending on emissions related programs.
2007 vs. 2006
Net Sales
Engine segment sales increased primarily due to the following drivers.
These increases were offset by a decrease in demand in the North American heavy-duty truck market as a result of the 2007 emissions standards change.
Total on-highway-related sales were 56 percent of Engine segment net sales in 2007 compared with 63 percent in 2006.
Segment EBIT
Engine segment EBIT decreased primarily due to lower engine volumes in the heavy-duty on-highway markets, the accompanying gross margin impact of lower absorption of fixed manufacturing costs, higher product costs and warranty accrual rates for new emissions compliant products and increased selling, general and administrative expenses. Gross margin decreased $113 million, or 8 percent, and gross margin percentage decreased 2.9 percentage points. Gross margin was lower due to higher material and warranty costs associated with the new 2007 engines. The increase in warranty expense was expected as the mix of 2007 emissions compliant engines increased. As has been our practice, and as described in our Critical Accounting Estimates, new product launches require a greater use of judgment in developing estimates until historical experience becomes available. Selling, general and administrative expense increased $64 million, or 12 percent, and remained flat as a percentage of net sales. The increase in selling, general and administrative expenses was primarily due to higher payroll costs as the result of salary increases and an increase in infrastructure investments including the number of employees to provide for the Engine segment's growing business. Research, development and engineering expenses decreased by $3 million, or 1 percent, and decreased slightly as a percentage of net sales. These overall increased segment expenses were partially offset by higher income from joint ventures over last year, primarily due to a $22 million improvement in income at DCEC due to strong demand in the Chinese truck market.
38
Power Generation Segment Results
Financial data for the Power Generation segment was as follows:
| |
|
|
|
Favorable/(Unfavorable) | |||||||||||||||||||
|---|---|---|---|---|---|---|---|---|---|---|---|---|---|---|---|---|---|---|---|---|---|---|---|
| |
Years ended December 31, | 2008 vs. 2007 | 2007 vs. 2006 | ||||||||||||||||||||
| Dollars in millions |
2008 | 2007 | 2006 | Amount | Percent | Amount | Percent | ||||||||||||||||
External sales |
$ | 2,601 | $ | 2,375 | $ | 1,880 | $ | 226 | 10 | % | $ | 495 | 26 | % | |||||||||
Intersegment sales |
899 | 685 | 536 | 214 | 31 | % | 149 | 28 | % | ||||||||||||||
Net sales |
3,500 | 3,060 | 2,416 | 440 | 14 | % | 644 | 27 | % | ||||||||||||||
Depreciation and amortization |
41 | 42 | 36 | 1 | 2 | % | (6 | ) | (17 | )% | |||||||||||||
Research, development and engineering expenses |
41 | 34 | 28 | (7 | ) | (21 | )% | (6 | ) | (21 | )% | ||||||||||||
Equity, royalty and interest income from investees |
23 | 17 | 12 | 6 | 35 | % | 5 | 42 | % | ||||||||||||||
Interest income |
3 | 6 | 7 | (3 | ) | (50 | )% | (1 | ) | (14 | )% | ||||||||||||
Segment EBIT |
376 | 334 | 220 | 42 | 13 | % | 114 | 52 | % | ||||||||||||||
Segment EBIT as a percentage of net sales |
10.7 |
% |
10.9 |
% |
9.1 |
% |
(0.2) percentage points |
1.8 percentage points |
|||||||||||||||
Our Power Generation segment includes the following businesses: commercial, consumer, power electronics, energy solutions and alternators. Sales for our Power Generation segment by business were as follows:
| |
|
|
|
Favorable/(Unfavorable) | |||||||||||||||||||
|---|---|---|---|---|---|---|---|---|---|---|---|---|---|---|---|---|---|---|---|---|---|---|---|
| |
Years ended December 31, | 2008 vs. 2007 | 2007 vs. 2006 | ||||||||||||||||||||
| Dollars in millions |
2008 | 2007 | 2006 | Amount | Percent | Amount | Percent | ||||||||||||||||
Commercial |
$ | 2,211 | $ | 1,781 | $ | 1,356 | $ | 430 | 24 | % | $ | 425 | 31 | % | |||||||||
Alternator |
686 | 623 | 448 | 63 | 10 | % | 175 | 39 | % | ||||||||||||||
Consumer |
238 | 349 | 317 | (111 | ) | (32 | )% | 32 | 10 | % | |||||||||||||
Other |
365 | 307 | 295 | 58 | 19 | % | 12 | 4 | % | ||||||||||||||
Total net sales |
$ | 3,500 | $ | 3,060 | $ | 2,416 | $ | 440 | 14 | % | $ | 644 | 27 | % | |||||||||
A summary of unit shipments used in power generation equipment by engine classification follows:
| |
|
|
|
Favorable/ (Unfavorable) | |||||||||||||||||||
|---|---|---|---|---|---|---|---|---|---|---|---|---|---|---|---|---|---|---|---|---|---|---|---|
| |
Years ended December 31, | 2008 vs. 2007 | 2007 vs. 2006 | ||||||||||||||||||||
| |
2008 | 2007 | 2006 | Amount | Percent | Amount | Percent | ||||||||||||||||
Mid-range |
33,400 | 31,700 | 29,200 | 1,700 | 5 | % | 2,500 | 9 | % | ||||||||||||||
Heavy-duty |
8,400 | 8,000 | 6,800 | 400 | 5 | % | 1,200 | 18 | % | ||||||||||||||
High-horsepower |
11,500 | 10,500 | 9,300 | 1,000 | 10 | % | 1,200 | 13 | % | ||||||||||||||
Total unit shipments |
53,300 | 50,200 | 45,300 | 3,100 | 6 | % | 4,900 | 11 | % | ||||||||||||||
2008 vs. 2007
Net Sales
Power Generation segment sales increased primarily due to the following drivers.
39
These increases were partially offset by a significant sales decrease in our consumer business, primarily due to the softening U.S. economy.
Segment EBIT
Power Generation segment EBIT increased primarily due to significant price realization, increased volume and favorable product mix. This was partially offset by increased material costs, including increased engine and commodity prices. Gross margin improved $83 million, or 15 percent, and the gross margin percentage remained flat compared to the prior year. Selling, general and administrative expenses increased by $20 million, or 8 percent, however, selling, general and administrative expenses improved by 0.5 percentage points, as a percentage of sales. The increase in selling, general and administrative expenses was primarily due to higher payroll costs and increases in the number of segment employees. Research, development and engineering expenses increased $7 million, or 21 percent; however, research, development and engineering expenses remained relatively flat as a percentage of sales.
2007 vs. 2006
Net Sales
Power Generation segment net sales increased over 2006, primarily due to the following drivers.
Segment EBIT
Power Generation segment EBIT increased, primarily due to the improved gross margin line as significant price realization, net of increased material costs and the absorption benefit from higher volumes improved segment income. Gross margin improved $147 million, or 35 percent, and the gross margin percentage improved by 1.1 percentage points. Selling, general and administrative expenses increased $39 million, or 18 percent, however, improved by 0.6 percentage points as a percentage of net sales. The increase in selling, general and administrative expenses was primarily due to higher payroll costs and increases in infrastructure investments including the number of employees to provide for the growing Power Generation business. Research, development and engineering expenses increased by $6 million, or 21 percent, and remained flat as a percentage of net sales.
40
Financial data for the Components segment was as follows:
| |
|
|
|
Favorable/(Unfavorable) | |||||||||||||||||||
|---|---|---|---|---|---|---|---|---|---|---|---|---|---|---|---|---|---|---|---|---|---|---|---|
| |
Years ended December 31, | 2008 vs. 2007 | 2007 vs. 2006 | ||||||||||||||||||||
| Dollars in millions |
2008 | 2007 | 2006 | Amount | Percent | Amount | Percent | ||||||||||||||||
External sales |
$ | 2,154 | $ | 2,007 | $ | 1,473 | $ | 147 | 7 | % | $ | 534 | 36 | % | |||||||||
Intersegment sales |
998 | 925 | 808 | 73 | 8 | % | 117 | 14 | % | ||||||||||||||
Net sales |
3,152 | 2,932 | 2,281 | 220 | 8 | % | 651 | 29 | % | ||||||||||||||
Depreciation and amortization |
65 | 59 | 57 | (6 | ) | (10 | )% | (2 | ) | (4 | )% | ||||||||||||
Research, development and engineering expenses |
95 | 73 | 68 | (22 | ) | (30 | )% | (5 | ) | (7 | )% | ||||||||||||
Equity, royalty and interest income from investees |
14 | 4 | 7 | 10 | NM | (3 | ) | (43 | )% | ||||||||||||||
Interest income |
3 | 3 | 2 | — | — | % | 1 | 50 | % | ||||||||||||||
Segment EBIT |
169 | 153 | 107 | 16 | 10 | % | 46 | 43 | % | ||||||||||||||
Segment EBIT as a percentage of net sales |
5.4 |
% |
5.2 |
% |
4.7 |
% |
0.2 percentage points |
0.5 percentage points |
|||||||||||||||
Our Components segment includes the following businesses: filtration, turbochargers, emission solutions, and fuel systems. Sales for our Components segment by business were as follows:
| |
|
|
|
Favorable/(Unfavorable) | |||||||||||||||||||
|---|---|---|---|---|---|---|---|---|---|---|---|---|---|---|---|---|---|---|---|---|---|---|---|
| |
Years ended December 31, | 2008 vs. 2007 | 2007 vs. 2006 | ||||||||||||||||||||
| Dollars in millions |
2008 | 2007 | 2006 | Amount | Percent | Amount | Percent | ||||||||||||||||
Filtration |
$ | 1,194 | $ | 1,215 | $ | 1,130 | $ | (21 | ) | (2 | )% | $ | 85 | 8 | % | ||||||||
Turbochargers |
979 | 860 | 608 | 119 | 14 | % | 252 | 41 | % | ||||||||||||||
Fuel Systems |
426 | 409 | 395 | 17 | 4 | % | 14 | 4 | % | ||||||||||||||
Emissions Solutions |
553 | 448 | 148 | 105 | 23 | % | 300 | NM | |||||||||||||||
Total net sales |
$ | 3,152 | $ | 2,932 | $ | 2,281 | $ | 220 | 8 | % | $ | 651 | 29 | % | |||||||||
2008 vs. 2007
Net Sales
Components segment sales increased primarily due to the following drivers.
41
These increases were partially offset by the sale of Universal Silencer and the discontinuance of a product line in 2007, which contributed a combined $75 million in sales in the year ended December 31, 2007.
Segment EBIT
Components segment EBIT increased primarily due to higher volumes in most of our businesses, manufacturing efficiencies and price realization in three of our businesses. Gross margin increased $69 million, or 17 percent, and the gross margin percentage increased 1.2 percentage points. The gross margin percentage improved primarily due to manufacturing efficiencies achieved in all of our businesses in 2008 and price realization greater than increased material prices due to higher commodity prices during the year, which was partially offset by increased warranty expense. Selling, general and administrative expenses increased $21 million, or 10 percent, and increased 0.2 percentage points, as a percentage of sales. The increase in selling, general and administrative expenses was primarily due to higher payroll costs and increases in the number of segment employees. Research, development and engineering expenses increased $22 million, or 30 percent, and increased 0.5 percentage points, as a percentage of sales. The increased research, development and engineering spending is focused on developing new products to meet future emissions standards for both developed and emerging markets.
2007 vs. 2006
Net Sales
Components segment sales increased primarily due to the following drivers.
Segment EBIT
Components segment EBIT increased primarily due to increased volumes and gross margins in most Components businesses and the sale of a business during 2007. Gross margin improved $68 million, or 20 percent, however, the gross margin percentage decreased 1.1 percentage points. Gross margin percentages were unfavorably impacted by higher metal costs and new product introduction costs. In addition, both our emission solutions and turbo technologies businesses experienced low margins as the result of costs associated with meeting extremely strong demand. Selling, general and administrative expenses increased $30 million, or 17 percent, however, selling, general and administrative expenses improved by 0.7 percentage points as a percentage of net sales. The increase in selling, general and administrative expenses was primarily due to higher payroll costs and increases in infrastructure investments including the number of employees to provide for the growing Components business. Research, development and engineering expenses increased by $5 million, or 7 percent, however, research, development and engineering expenses improved by
42
0.5 percentage points as a percentage of net sales. Segment EBIT was also favorably impacted by the $10 million gain on the sale of Universal Silencer.
Financial data for the Distribution segment was as follows:
| |
|
|
|
Favorable/(Unfavorable) | |||||||||||||||||||
|---|---|---|---|---|---|---|---|---|---|---|---|---|---|---|---|---|---|---|---|---|---|---|---|
| |
Years ended December 31, | 2008 vs. 2007 | 2007 vs. 2006 | ||||||||||||||||||||
| Dollars in millions |
2008 | 2007 | 2006 | Amount | Percent | Amount | Percent | ||||||||||||||||
External sales |
$ | 2,155 | $ | 1,537 | $ | 1,369 | $ | 618 | 40 | % | $ | 168 | 12 | % | |||||||||
Intersegment sales |
9 | 3 | 16 | 6 | NM | (13 | ) | (81 | )% | ||||||||||||||
Net sales |
2,164 | 1,540 | 1,385 | 624 | 41 | % | 155 | 11 | % | ||||||||||||||
Depreciation and amortization |
25 | 11 | 11 | (14 | ) | NM | — | — | % | ||||||||||||||
Equity, royalty and interest income from investees |
117 | 92 | 54 | 25 | 27 | % | 38 | 70 | % | ||||||||||||||
Interest income |
2 | 1 | 2 | 1 | 100 | % | (1 | ) | (50 | )% | |||||||||||||
Segment EBIT |
242 | 187 | 144 | 55 | 29 | % | 43 | 30 | % | ||||||||||||||
Segment EBIT as a percentage of net sales |
11.2 |
% |
12.1 |
% |
10.4 |
% |
(0.9) percentage points |
1.7 percentage points |
|||||||||||||||
2008 vs. 2007
Net Sales
Distribution segment sales increased as a result of the following drivers.
The higher sales were led by increased sales volumes in power generation, parts and engine volumes, followed by service.
Segment EBIT
Distribution segment EBIT increased primarily due to increased sales volumes for power generation, parts and engines followed by service and improved pricing. However, segment EBIT decreased as a percentage of sales, primarily due to unfavorable currency translation adjustments which negatively impacted our EBIT as a percentage of sales by 1.3 percentage points. Excluding the $17 million impact of three new distributors consolidated during the year and one new North American joint venture, EBIT was $225 million for the year and decreased 0.3 percentage points as a percentage of sales. Gross margin increased by $145 million, or 45 percent, and improved 0.7 percentage points as a percentage of sales. The increase in gross margin was primarily due to the increase in sales volumes and improved pricing. Selling, general and administrative expenses increased $78 million, or 31 percent, however, selling, general and administrative expenses improved by 1.2 percentage points as a percentage of sales. The increase in selling, general and administrative expenses was primarily due to higher payroll costs as the result of 2008 salary increases and an increase in the number of segment employees including increased costs related to the acquisition of three new distributors and the North American joint venture.
43
2007 vs. 2006
Net Sales
Distribution segment sales increased as a result of the following drivers.
The higher sales were led by increased sales volumes in power generation, engine and parts.
These increases were partially offset by the deconsolidation of one of our North American joint ventures that accounted for approximately $163 million or 12 percent of sales in the year ended 2006.
Segment EBIT
Distribution segment EBIT increased primarily due to equity, royalty and interest income from investees led by a $35 million increase from our North American Distributors. Gross margin improved $14 million, or 5 percent, however, the gross margin percentage decreased 1.4 percentage points. The decrease in gross margin percentage was primarily due to the deconsolidation of one of our North American joint ventures in 2007. Selling, general and administrative expenses increased $15 million, or 6 percent, however, selling, general and administrative expenses improved by 0.7 percentage points as a percentage of net sales. The increase in selling, general and administrative expenses was primarily due to higher payroll costs as the result of 2007 salary increases, an increase in infrastructure investments, including the number of employees to provide for the growing Distribution business and unfavorable foreign currency translation.
Reconciliation of Segment EBIT to Income Before Income Taxes and Minority Interests
The table below reconciles the segment information to the corresponding amounts in the Consolidated Statements of Income:
| |
Years ended December 31, | ||||||||||
|---|---|---|---|---|---|---|---|---|---|---|---|
| |
2008 | 2007 | 2006 | ||||||||
| |
in millions |
||||||||||
Total segment EBIT |
$ | 1,322 | $ | 1,263 | $ | 1,204 | |||||
Non-segment EBIT(1) |
(102 | ) | (36 | ) | (25 | ) | |||||
Total EBIT |
$ | 1,220 | $ | 1,227 | $ | 1,179 | |||||
Less: |
|||||||||||
Interest expense |
42 | 58 | 96 | ||||||||
Income before income taxes and minority interests |
$ | 1,178 | $ | 1,169 | $ | 1,083 | |||||
Sales to international markets were 59 percent of total net sales in 2008, compared with 54 percent of total net sales in 2007 and 50 percent of total net sales in 2006.
44
A summary of net sales (dollar amount and percentage of total) by geographic territory follows (dollars in millions):
| |
Years ended December 31, | |||||||||||||||||||
|---|---|---|---|---|---|---|---|---|---|---|---|---|---|---|---|---|---|---|---|---|
| (in millions) |
2008 | 2007 | 2006 | |||||||||||||||||
United States |
$ | 5,817 | 41 | % | $ | 6,007 | 46 | % | $ | 5,719 | 50 | % | ||||||||
Asia/Australia |
3,008 | 21 | % | 2,444 | 19 | % | 1,794 | 16 | % | |||||||||||
Europe/CIS(1) |
2,586 | 18 | % | 2,326 | 18 | % | 1,633 | 14 | % | |||||||||||
Mexico/Latin America |
1,473 | 10 | % | 1,171 | 9 | % | 886 | 8 | % | |||||||||||
Canada |
619 | 4 | % | 405 | 3 | % | 743 | 7 | % | |||||||||||
Africa/Middle East |
839 | 6 | % | 695 | 5 | % | 587 | 5 | % | |||||||||||
Total international |
8,525 | 59 | % | 7,041 | 54 | % | 5,643 | 50 | % | |||||||||||
Total consolidated net sales |
$ | 14,342 | 100 | % | $ | 13,048 | 100 | % | $ | 11,362 | 100 | % | ||||||||
45
LIQUIDITY AND CAPITAL RESOURCES
Management's Assessment of Liquidity
We believe our financial condition and liquidity remain strong despite the downturn in the U.S. and global economies. Our strong balance sheet and improved credit ratings enabled us to secure a new Three-Year Revolving Credit Facility in the third quarter of 2008.
We assess our liquidity in terms of our ability to generate adequate cash to fund our operating, investing and financing activities. Cash provided by operations is our principal source of liquidity. As of December 31, 2008, other sources of liquidity include:
The maturity schedule of our existing long-term debt does not require significant cash outflows in the intermediate term. Required annual principal payments range from $12 million to $32 million over each of the next five years.
While the impact of the continued market volatility cannot be predicted, we believe our liquidity will provide us with the financial flexibility needed to fund working capital, capital expenditures, projected pension obligations, dividend payments and debt service obligations.
We have considered the impact of recent market instability and credit availability in assessing the adequacy of our liquidity and capital resources. We expect that general market conditions could impact the rate at which we realize our receivables in the future and could impact eligible receivables under our accounts receivable program, however, we expect to generate positive cash flow from operations in 2009. We will continue to diligently monitor our receivables for potential slowing in collections that could occur as a result of softening economic conditions and our customer's access to credit. The overall decline in market valuations has impacted the current value of our pension trusts as discussed in more detail below.
At this time, we are comfortable that the available credit capacity under our revolving credit facility is available to us. This assertion is based upon the fact that we drew upon our revolving credit facility with a prompt repayment in February 2009 to confirm participation by the banks included in the facility. As a result, we believe our access to liquidity sources has not been materially impacted by the current credit environment and we do not expect that it will be materially impacted in the near future. There can be no assurance, however, that the cost or availability of future borrowings, if any, in the debt markets or our credit facilities will not be materially impacted by the ongoing capital market disruptions.
A significant portion of our cash flows is generated outside the U.S. More than half of our cash and cash equivalents and most of our marketable securities at December 31, 2008, are denominated in foreign currencies. We manage our worldwide cash requirements considering available funds among the many subsidiaries through which we conduct our business and the cost effectiveness with which those funds can be accessed. The repatriation of cash balances from certain subsidiaries could have adverse tax consequences; however, those balances are generally available without legal restrictions to fund ordinary business operations at the local level. We have and will continue to transfer cash from these subsidiaries to us and to other international subsidiaries when it is cost effective to do so.
46
We fund our working capital with cash from operations and short-term borrowings when necessary. Various assets and liabilities, including short-term debt, can fluctuate significantly from month to month depending on short-term liquidity needs. As a result, working capital is a prime focus of management attention.
| |
2008 | 2007 | |||||
|---|---|---|---|---|---|---|---|
| |
in millions |
||||||
Current assets |
$ | 4,713 | $ | 4,815 | |||
Current liabilities |
2,639 | 2,711 | |||||
Working capital |
$ | 2,074 | $ | 2,104 | |||
Current ratio |
1.79 | 1.78 | |||||
Days' sales in receivables |
48 | 53 | |||||
Inventory turnover |
6.2 | 6.5 | |||||
Current assets decreased $102 million, primarily due to a $216 million decrease in receivables due to lower sales in the fourth quarter, a $151 million decrease in cash (see Cash Flows below), and a decrease of $43 million in marketable securities due to the decline in the overall market. These decreases were partially offset by a $146 million increase in prepaid expenses and other current assets, a $91 million increase in inventory and a $71 million increase in deferred income taxes. The increase in prepaid expenses and other current assets was primarily due to the increase in refundable income taxes.
Current liabilities decreased $72 million, primarily due to a decrease in accounts payable of $254 million due to reduced purchases in the fourth quarter, a decrease in accrued compensation, benefits and retirement costs of $77 million and a decrease in short-term borrowings of $50 million. These decreases were offset by an increase of $212 million in other accrued expenses and an increase in accrued warranty of $97 million. The increase in other accrued expenses was primarily due to the recognition of liabilities related to commodity and currency hedges, increased deferred revenue and increased workers compensation accruals.
Cash and cash equivalents decreased by $151 million during the year ended December 31, 2008. The change in cash and cash equivalents is as follows:
| |
2008 | 2007 | 2006 | |||||||
|---|---|---|---|---|---|---|---|---|---|---|
| |
in millions |
|||||||||
Net cash provided by operating activities |
$ | 987 | $ | 810 | $ | 840 | ||||
Net cash used in investing activities |
(848 | ) | (515 | ) | (277 | ) | ||||
Net cash used in financing activities |
(237 | ) | (576 | ) | (508 | ) | ||||
Effect of exchange rate changes on cash |
(53 | ) | 18 | 6 | ||||||
Net (decrease) increase in cash and cash equivalents |
$ | (151 | ) | $ | (263 | ) | $ | 61 | ||
2008 vs. 2007
Net cash provided by operating activities increased $177 million for the year ended December 31, 2008, compared to 2007. In both 2008 and 2007, our principal source of cash from operations was net income of $755 million and $739 million, respectively, which reflected strong operational performance in both years. For 2008, the net income contribution was partially offset by a growth in working capital of $267 million and pension contributions of $102 million. The growth in 2008 working capital was
47
largely driven by higher inventories of $251 million and lower accounts payable of $174 million which was partially offset by higher accrued expenses of $124 million and a decrease in accounts receivable of $88 million. The increase in inventory was primarily to support strong business growth while the decrease in accounts payable was more reflective of early shutdowns in many of our manufacturing facilities at the close of 2008, as demand softened throughout the fourth quarter. The increase in accrued expenses was primarily due to an increase in warranty expense and the decrease in accounts receivable was driven by the early shutdown and softening demand.
For 2007, working capital increased by $139 million as sales and production growth generated a combined increase in inventory and accounts receivable of $458 million. However, this amount was largely funded by a $353 million increase in accounts payable and accrued liabilities, also in support of strong volumes. In addition, pension contributions of $250 million offset strong net income performance.
Pensions
The funded status of our pension plans is dependent upon a variety of variables and assumptions including return on invested assets, market interest rates and levels of voluntary contributions to the plans. As the result of the ongoing credit crisis and the related market recession, our pension assets have experienced significant deterioration during 2008. Through the end of 2008, short-term returns for both our U.S. and U.K. pension plans are significantly below our long-term expected rate of return of 8.25 percent and 7.25 percent, respectively, used in our assumptions due to adverse conditions in the equity markets. As a result of losses experienced in global equity markets which began at the end of the third quarter and accelerated in the fourth quarter, our pension funds had significant negative returns for 2008, which resulted in a $695 million ($445 million after-tax) charge to shareholders' equity in the fourth quarter and thus will create increased pension costs in 2009. Approximately 96 percent of our pension plan assets are invested in highly liquid investments such as equity and fixed income securities. The remaining four percent of our plan assets are invested in less liquid but market valued investments, including real estate and private equity. We made pension contributions of $102 million to our pension plans in 2008. We anticipate making contributions of $125 million to $135 million to our pension plans in 2009. Expected contributions to our defined pension plans in 2009 will meet or exceed the current funding requirements. Claims and premiums for other postretirement benefits are expected to approximate $53 million in 2009. The $102 million of pension contributions in 2008 included voluntary contributions of $70 million. These contributions and payments include payments from Company funds either to increase pension plan assets or to make direct payments to plan participants.
2007 vs. 2006
Net cash provided by operating activities declined $30 million for the year ended December 31, 2007, compared to 2006. In both 2007 and 2006, our principal source of cash from operations was net income of $739 million and $715 million, respectively, which reflected strong operational performance in both years. For 2007, working capital increased by $139 million as sales and production growth generated a combined increase in inventory and accounts receivable of $458 million. However, this amount was largely funded by a $353 million increase in accounts payable and accrued liabilities. In addition, pension contributions of $250 million offset net income performance.
For 2006, working capital increased by $191 million as sales and production growth generated a combined increase in inventory and accounts receivable of $459 million which was partially funded by a $272 million increase in accounts payable and accrued liabilities. In addition, pension contributions of $266 million offset strong net income performance.
48
2008 vs. 2007
Net cash used in investing activities increased $333 million for the year ended 2008, compared to 2007. The increase was primarily due to a $190 million increase in capital expenditures, higher investments in businesses of $122 million related to the purchase of three previously independent distributors and the acquisition of Consolidated Diesel Corporation, a manufacturing facility (see Note 21 to the Consolidated Financial Statements for additional information), increased cash flows for undesignated hedges of $39 million and higher investments in and advances to equity investees of $23 million. These increases were partially offset by a $29 million increase in the proceeds from the sale of equity investments due to the sale of the European Engine Alliance in 2008 (see Note 21 to our Consolidated Financial Statements).
Capital expenditures for the year ended 2008 increased 54 percent over 2007 to support our growth, and included investments to increase capacity and to fund development of our new products. Our investments in capacity improvements and development of new products accelerated across all of our businesses. We continue to invest approximately 35 percent of our capital in low-cost regions of the world to further leverage our opportunities for cost reduction and future growth opportunities. Capital expenditures for 2008 were $543 million. In preparation for the challenging economic climate expected in 2009, we have tightened capital expenditures to preserve cash during the recession, and as a result, expect an approximate 30 percent reduction of spending from 2008 levels. This spending excludes any assets that may need to be purchased as a result of the flood. We anticipate remaining flood related expenditures will range from $55 million to $65 million and will occur over the next four quarters.
2007 vs. 2006
Net cash used in investing activities increased $238 million in 2007, compared to 2006. The increase was primarily due to a $104 million increase in capital expenditures, a $57 million outflow for the purchase of long-term investments, an increase of $48 million in cash used for investments in and advances to equity investees and an increased outflow of $18 million for the acquisition of businesses, the majority of which was to acquire the remaining 50 percent equity ownership in a 50/50 joint venture.
49
Capital expenditures for the year ended 2007 increased 42 percent over 2006 to support our growth, and included investments to increase capacity and to fund development of our new products.
2008 vs. 2007
Net cash used in financing activities decreased $339 million in 2008, compared to 2007. The majority of the decrease in cash outflows was due to the decrease in repurchase of common stock of $207 million, the increase in proceeds from borrowings of $61 million, the $50 million increase in proceeds from sale of stock held by employee benefit trust and a $45 million increase in net borrowings under short-term credit arrangements. These fluctuations were partially offset by the increase in dividend payments of $33 million.
Our total debt was $698 million as of December 31, 2008, compared with $674 million at December 31, 2007. Total debt as a percent of our total capital, including total long-term debt, was 17.8 percent at December 31, 2008, compared to 16.5 percent at December 31, 2007. The 2008 debt to capital ratio was negatively impacted by a $675 million ($433 million after tax) charge to shareholders' equity to recognize the funded status of our defined benefit pension and other postretirement plans.
2007 vs. 2006
Net cash used in financing activities increased $68 million in 2007, compared to 2006. The majority of the increase in cash outflows is due to the increase in repurchases of common stock of $214 million and a decrease in the proceeds from borrowings of $79 million, which was partially offset by a $256 million decrease in payments on borrowings and capital leases.
Revolving Credit Agreement
On June 30, 2008, we entered into a Three-Year Revolving Credit Agreement, dated as of June 30, 2008 (the "Credit Agreement"), with a syndicate of lenders and issuers named therein. The Credit Agreement provides a $1.1 billion senior unsecured revolving credit facility (the "Credit Facility"), the proceeds of which are to be used to provide working capital or for other general corporate purposes of Cummins.
The Credit Facility matures on June 30, 2011. The Credit Facility is unsecured and amounts payable under it will rank pro rata with all other unsecured, unsubordinated indebtedness of Cummins. A portion of the Credit Facility, up to $100 million, is available for swingline loans denominated in U.S. dollars. Loans will bear interest at (i) a base rate or (ii) a rate equal to LIBOR plus an applicable margin based on the credit ratings of Cummins outstanding senior unsecured long-term debt. Based on our current long-term debt ratings, the applicable margin on LIBOR loans was 2.0 percent per annum as of December 31, 2008. Loans may be prepaid without premium or penalty, subject to customary breakage costs.
The Credit Facility replaces $650 million in aggregate principal amount of a revolving credit facility (Former Credit Agreement) maintained by Cummins which was terminated effective June 30, 2008.
The Credit Agreement includes covenants substantially similar to those in the Former Credit Agreement, including, among others, (a) a leverage ratio, (b) fixed charge coverage ratio, (c) limitations on priority indebtedness, (d) limitations on our ability to consummate a merger, consolidation or sale of all or substantially all of our assets and (e) limitations on our ability to change the nature of our business.
The obligation of Cummins to pay amounts outstanding under the Credit Facility may be accelerated upon the occurrence of an "Event of Default" as defined in the Credit Agreement. Such
50
Events of Default include, among others, (a) Cummins failure to pay the principal of, or interest on, borrowings under the Credit Facility, (b) any representation or warranty of Cummins in the Credit Agreement proving to be materially false or misleading, (c) Cummins breach of any of its covenants contained in the Credit Agreement and (d) the bankruptcy or insolvency of Cummins.
There are no material relationships between Cummins or its affiliates and any of the Lenders, other than as described above.
Repurchase of Common Stock
We announced in February 2009 that we have temporarily suspended our stock repurchase program to conserve cash.
In December 2007, the Board of Directors authorized the acquisition of up to $500 million of Cummins common stock. We began making purchases under the plan in March 2008 and purchased $128 million of stock during 2008 at an average cost of $55.49 per share.
In July 2006, the Board of Directors authorized us to acquire up to eight million shares of Cummins common stock. In 2007, we repurchased approximately $335 million of common stock, at an average cost of $55.76 per share, representing approximately six million shares. This concluded the share repurchase program authorized by the Board of Directors in July 2006.
Quarterly Dividends
In July 2008, the Board of Directors voted to increase the quarterly cash dividend per share by 40 percent and increased cash dividends from $0.125 per common share to $0.175 per common share. Dividends per share paid to common shareholders for the years ended December 31, were as follows:
| |
Quarterly Dividends | |||||||||
|---|---|---|---|---|---|---|---|---|---|---|
| |
2008 | 2007 | 2006 | |||||||
First Quarter |
$ | 0.125 | $ | 0.09 | $ | 0.075 | ||||
Second Quarter |
0.125 | 0.09 | 0.075 | |||||||
Third Quarter |
0.175 | 0.125 | 0.09 | |||||||
Fourth Quarter |
0.175 | 0.125 | 0.09 | |||||||
Total dividends paid to common shareholders for the years ended December 31, 2008, 2007 and 2006 were $122 million, $89 million, and $66 million, respectively. Declaration and payment of dividends in the future depends upon income and liquidity position, among other factors.
Financial Covenants and Credit Rating
A number of our contractual obligations and financing agreements, such as our revolving credit facility and our equipment sale-leaseback agreements have restrictive covenants and/or pricing modifications that may be triggered in the event of downward revisions to our corporate credit rating. There have been no events in 2008 to impede our compliance with these covenants.
On March 10, 2008, Standard & Poor's (S&P) upgraded our senior unsecured debt ratings from "BBB-" to "BBB" and revised our outlook to stable citing Cummins' improved operating performance over the past several years, including during the expected emissions-related downturn in heavy-duty truck demand in 2007, combined with significant on- and off-balance sheet debt reduction, and increased business diversification.
On June 17, 2008, Fitch upgraded our senior unsecured debt ratings from "BBB" to "BBB+" citing Cummins' recent market share gains and improving credit profile, including improvement in Cummins' geographic and business diversification.
51
Our current ratings and outlook from each of the credit rating agencies are shown in the table below.
Credit Rating Agency
|
Senior L-T Debt Rating | S-T Debt Rating | Outlook | |||
|---|---|---|---|---|---|---|
Moody's Investors Service, Inc. |
Baa3 | Non-Prime | Stable | |||
Standard & Poor's |
BBB | NR | Stable | |||
Fitch |
BBB+ | BBB+ | Stable |
CONTRACTUAL OBLIGATIONS AND OTHER COMMERCIAL COMMITMENTS
A summary of payments due for our contractual obligations and commercial commitments, as of December 31, 2008, is shown in the tables below:
Contractual Cash Obligations
|
2009 | 2010-2011 | 2012-2013 | After 2013 | Total | |||||||||||
|---|---|---|---|---|---|---|---|---|---|---|---|---|---|---|---|---|
| |
(in millions) |
|||||||||||||||
Loans payable |
$ | 39 | $ | — | $ | — | $ | — | $ | 39 | ||||||
Long-term debt and capital lease obligations(1) |
94 | 168 | 122 | 1,540 | 1,924 | |||||||||||
Operating leases |
54 | 70 | 30 | 43 | 197 | |||||||||||
Capital expenditures |
163 | 84 | 9 | — | 256 | |||||||||||
Purchase commitments for inventory |
443 | 2 | — | — | 445 | |||||||||||
Other purchase commitments |
118 | 45 | 4 | — | 167 | |||||||||||
Pension funding(2) |
28 | — | — | — | 28 | |||||||||||
Other postretirement benefits |
53 | 106 | 100 | 244 | 503 | |||||||||||
Total |
$ | 992 | $ | 475 | $ | 265 | $ | 1,827 | $ | 3,559 | ||||||
The contractual obligations reported above exclude our unrecognized tax benefits of $57 million, all of which is non-current, as of December 31, 2008. We are not able to reasonably estimate the
52
period in which cash outflows relating to uncertain tax contingencies could occur. See Note 4 to the Consolidated Financial Statements for further details.
Other Commercial Commitments
|
2009 | 2010-2011 | 2012-2013 | After 2013 | Total | |||||||||||
|---|---|---|---|---|---|---|---|---|---|---|---|---|---|---|---|---|
| |
(in millions) |
|||||||||||||||
Standby letters of credit under revolving credit agreement |
$ | 35 | $ | — | $ | — | $ | — | $ | 35 | ||||||
International and other domestic letters of credit |
35 | 4 | — | 1 | 40 | |||||||||||
Performance and excise bonds |
13 | 12 | 3 | 4 | 32 | |||||||||||
Guarantees and other commitments(1) |
26 | — | 3 | 33 | 62 | |||||||||||
Total |
$ | 109 | $ | 16 | $ | 6 | $ | 38 | $ | 169 | ||||||
In July 2007, we amended our agreement with a financial institution to sell a designated pool of trade receivables to Cummins Trade Receivables, LLC (CTR), a wholly-owned special purpose subsidiary, to extend the facility until July 2010, and raised the purchase limitation from $200 million to $400 million. The agreement also provides us with an option to increase the purchase limitation up to $500 million upon approval. As necessary, CTR may transfer a direct interest in its receivables, without recourse, to the financial institution. To maintain a balance in the designated pools of receivables sold, we sell new receivables to CTR as existing receivables are collected. Receivables sold to CTR in which an interest is not transferred to the financial institution are included in "Receivables, net" on our Consolidated Balance Sheets. The maximum interest in sold receivables that can be outstanding at any point in time is limited to the lesser of $400 million or the amount of eligible receivables held by CTR. There are no provisions in this agreement that require us to maintain a minimum investment credit rating; however, the terms of the agreement contain the same financial covenants as our revolving credit facility. As of December 31, 2008, the amount available under this program was $170 million. As of December 31, 2008 and 2007, there were no amounts outstanding under this program.
Financing Arrangements for Related Parties
In accordance with the provisions of various joint venture agreements, we may purchase and/or sell products and components from/to the joint ventures and the joint ventures may sell products and components to unrelated parties. The transfer price of products purchased from the joint ventures may differ from normal selling prices. Certain joint venture agreements transfer product to us at cost, some transfer product to us on a cost-plus basis and other agreements provide for the transfer of products at market value.
APPLICATION OF CRITICAL ACCOUNTING ESTIMATES
A summary of our significant accounting policies is included in Note 1 to the Consolidated Financial Statements of this annual report which discusses accounting policies that we have selected from acceptable alternatives. There were no accounting policies adopted during 2008 that had a material impact on our financial condition or results of operations.
Our Consolidated Financial Statements are prepared in accordance with GAAP which often requires management to make judgments, estimates and assumptions regarding uncertainties that affect
53
the reported amounts presented and disclosed in the financial statements. Our management reviews these estimates and assumptions based on historical experience, changes in business conditions and other relevant factors they believe to be reasonable under the circumstances. In any given reporting period, our actual results may differ from the estimates and assumptions used in preparing our Consolidated Financial Statements.
Critical accounting estimates are defined as follows: the estimate requires management to make assumptions about matters that were highly uncertain at the time the estimate was made; different estimates reasonably could have been used; or if changes in the estimate are reasonably likely to occur from period to period and the change would have a material impact on our financial condition or results of operations. Our senior management has discussed the development and selection of our accounting policies, related accounting estimates and the disclosures set forth below with the Audit Committee of our Board of Directors. We believe our critical accounting estimates include those addressing the estimation of liabilities for warranty programs, accounting for income taxes, pension benefits and annual assessment of recoverability of goodwill.
We estimate and record a liability for warranty programs, primarily base warranty and other than product recalls, at the time our products are sold. Our estimates are based on historical experience and reflect management's best estimates of expected costs at the time products are sold and subsequent adjustment to those expected costs when actual costs differ. As a result of the uncertainty surrounding the nature and frequency of product recall programs, the liability for such programs is recorded when we commit to a recall action, which generally occurs when it is announced. Our warranty liability is generally affected by component failure rates, repair costs and the time of failure. Future events and circumstances related to these factors could materially change our estimates and require adjustments to our liability. New product launches require a greater use of judgment in developing estimates until historical experience becomes available. Product specific experience is typically available four or five quarters after product launch, with a clear experience trend evident eight quarters after launch. We generally record warranty expense for new products upon shipment using a factor based upon historical experience only in the first year, a blend of actual product and historical experience in the second year and product specific experience thereafter. Note 12 to the Consolidated Financial Statements contains a summary of the activity in our warranty liability account for 2008 and 2007 including adjustments to pre-existing warranties.
We determine our provision for income taxes using the asset and liability method. Under this method, deferred tax assets and liabilities are recognized for the future tax effects of temporary differences between the financial statement carrying amounts of existing assets and liabilities and their respective tax bases. Future tax benefits of tax loss and credit carryforwards are also recognized as deferred tax assets. We evaluate the recoverability of our deferred tax assets each quarter by assessing the likelihood of future profitability and available tax planning strategies that could be implemented to realize our net deferred tax assets. At December 31, 2008, we recorded net deferred tax assets of $835 million. These assets include $40 million for the value of tax loss and credit carryforwards. A valuation allowance of $25 million has been recorded to reduce the tax assets to the net value management believes is more likely than not to be realized. In the event our operating performance deteriorates, future assessments could conclude that a larger valuation allowance will be needed to further reduce the deferred tax assets. In addition, we operate within multiple taxing jurisdictions and are subject to tax audits in these jurisdictions. These audits can involve complex issues, which may require an extended period of time to resolve. We reduce our net tax assets for the estimated additional tax and interest that may result from tax authorities disputing uncertain tax positions we
54
have taken and we believe we have made adequate provision for income taxes for all years that are subject to audit based upon the latest information available. A more complete description of our income taxes and the future benefits of our tax loss and credit carryforwards is disclosed in Note 4 to the Consolidated Financial Statements.
We sponsor a number of pension plans primarily in the U.S. and the U.K. and to a lesser degree in various other countries. In the U.S. and the U.K. we have several major defined benefit plans that are separately funded. We account for our pension programs in accordance with Statement of Financial Accounting Standards (SFAS) No. 87, "Employers' Accounting for Pensions," (SFAS 87) and SFAS No. 158, "Employers' Accounting for Defined Benefit Pension and Other Postretirement Plans—an amendment of FASB Statements No. 87, 88, 106 and 132 (R)" (SFAS 158). SFAS 87 requires that amounts recognized in financial statements be determined using an actuarial basis. As a result, our pension benefit programs are based on a number of statistical and judgmental assumptions that attempt to anticipate future events and are used in calculating the expense and liability related to our plans. These assumptions include discount rates used to value liabilities, assumed rates of return on plan assets, future compensation increases, employee turnover rates, actuarial assumptions relating to retirement age, mortality rates and participant withdrawals. The actuarial assumptions we use may differ significantly from actual results due to changing economic conditions, participant life span and withdrawal rates. These differences may result in a material impact to the amount of net periodic pension expense to be recorded in our Consolidated Financial Statements in the future. SFAS 158 requires an employer to recognize the overfunded or underfunded status of a defined benefit postretirement plan as an asset or liability in its statement of financial position and to recognize changes in that funded status in the year in which the changes occur through comprehensive income. The Statement also requires an employer to measure the funded status of a plan as of the date of its year-end statement of financial position. We adopted SFAS 158, except for the measurement date change, as required on December 31, 2006. We adopted the measurement date change as of January 1, 2008.
The expected long-term return on plan assets is used in calculating the net periodic pension expense. We considered several factors in developing our expected rate of return on plan assets. The long-term rate of return considers historical returns and expected returns on current and projected asset allocations and is generally applied to a 5-year average market value of return. The long-term rate of return on plan assets represents an estimate of long-term returns on an investment portfolio consisting of a mixture of equities, fixed income, real estate and other miscellaneous investments. The differences between the actual return on plan assets and expected long-term return on plan assets are recognized in the asset value used to calculate net periodic expense over five years. The table below sets forth the expected return assumptions used to develop our pension expense for the period 2006-2008 and our expected rate for 2009.
Long-Term Expected Return Assumptions
| |
2009 | 2008 | 2007 | 2006 | |||||||||
|---|---|---|---|---|---|---|---|---|---|---|---|---|---|
U.S. Plans |
8.25 | % | 8.25 | % | 8.50 | % | 8.50 | % | |||||
Non-U.S. Plans |
7.25 | % | 7.25 | % | 7.24 | % | 7.24 | % | |||||
A lower expected rate of return will increase our net periodic pension expense and reduce profitability.
The difference between the expected return and the actual return on plan assets is deferred from recognition in our results of operations and, under certain circumstances such as when the difference exceeds 10 percent of the market value of plan assets or the projected benefit obligation (PBO),
55
amortized over future years of service. This is also true of changes to actuarial assumptions. As of December 31, 2008, we had net pension actuarial losses of $837 million and $322 million for the U.S. and non-U.S. pension plans, respectively. Under SFAS 158, the actuarial gains and losses are recognized and recorded in accumulated other comprehensive loss. As these amounts exceed 10 percent of our PBO, the excess is amortized over the average remaining service lives of participating employees.
The table below sets forth the net periodic pension expense for the period 2006-2008 and our expected expense for 2009.
| |
2009 | 2008 | 2007 | 2006 | |||||||||
|---|---|---|---|---|---|---|---|---|---|---|---|---|---|
Pension Expense (in millions) |
$ | 82 | $ | 71 | $ | 98 | $ | 120 | |||||
The decrease in periodic pension expense in 2008 was due to higher expected returns on assets driven by the significant pension contributions we made in 2007. Another key assumption used in the development of the net periodic pension expense is the discount rate. The discount rates used to develop our net periodic pension expense are set forth in the table below.
| |
2009 | 2008 | 2007 | 2006 | |||||||||
|---|---|---|---|---|---|---|---|---|---|---|---|---|---|
U.S. Plans |
6.20 | % | 6.10 | % | 5.60 | % | 5.60 | % | |||||
Non-U.S. Plans |
6.20 | % | 5.80 | % | 4.96 | % | 4.95 | % | |||||
Changes in the discount rate assumptions will impact the interest cost component of the net periodic pension expense calculation.
The discount rate enables us to state expected future cash payments for benefits as a present value on the measurement date. The guidelines for setting this rate are discussed in EITF D-36 which suggests the use of a high-quality corporate bond rate. We used bond information provided by Standard & Poors for the U.S. and iBoxx for the U.K. All bonds used to develop our hypothetical portfolio in the U.S. and U.K. were high-quality, non-callable bonds (AA- or better) as of December 31, 2008. However, for the U.K., we removed the bonds from the index that were downgraded during December 2008, but had not yet been removed from the iBoxx AA index at the measurement date. The average yield of this hypothetical bond portfolio was used as the benchmark for determining the discount rate to be used to value the obligations of the plans subject to SFAS 87 and SFAS No. 106, "Employer's Accounting for Postretirement Benefits Other Than Pensions." In addition, for the U.S. plans, the cash flows were matched to the Citigroup Pension Discount Curve as of December 31, 2008. The results of that exercise provided a 6.257 percent rate which confirmed our selection.
Our model called for 60 years of benefit payments. For the U.S. plans, the sum of the cash flows from the 60 bonds matched the cash flow from the benefit payment stream upon completion of the process. The number of bonds purchased for each issue was used to determine the price of the entire portfolio. The discount rate benchmark was set to the internal rate of return needed to discount the cash flows to arrive at the portfolio price.
In developing the U.K. discount rate, excess cash flows resulted in the early years of the 60 year period when the sum of the cash flow from the bonds maturing in later years exceeded the benefit payments in early years, thus no bonds maturing in early years are needed. As a result, the price of the entire portfolio of bonds was too high because all benefit payments were covered with excess cash flow remaining. We made no adjustment to the cash flow and the discount rate was determined as the internal rate of return needed to discount the cash flows to arrive at the portfolio price.
56
The table below sets forth the estimated impact on our 2009 net periodic pension expense relative to a change in the discount rate and a change in the expected rate of return on plan assets.
| |
Impact on Pension Expense Increase (Decrease) |
||||
|---|---|---|---|---|---|
| |
in millions |
||||
Discount rate used to value liabilities: |
|||||
0.25 percent increase |
$ | (4 | ) | ||
0.25 percent decrease |
4 | ||||
Expected rate of return on assets: |
|||||
1 percent increase |
(25 | ) | |||
1 percent decrease |
25 | ||||
The above sensitivities reflect the impact of changing one assumption at a time. A higher discount rate decreases the plan obligations and decreases our net periodic pension expense. A lower discount rate increases the plan obligations and increases our net periodic pension expense. It should be noted that economic factors and conditions often affect multiple assumptions simultaneously and the effects of changes in key assumptions are not necessarily linear.
Our investment policies in the U.S. and U.K. provide for the rebalancing of assets to maintain our long-term strategic asset allocation. We are committed to its long-term strategy and do not attempt to time the market given empirical evidence that asset allocation is more critical than individual asset or investment manager selection. Rebalancing of the assets has and continues to occur. The rebalancing is critical to having the proper weighting of assets to achieve the expected total portfolio returns. Based upon our target asset allocations it is anticipated that our U.S. investment policy will generate an average annual return over the 20-year projection period equal to or in excess of 7.5 percent approximately 50 percent of the time while returns of 9.0 percent or greater are anticipated 25 percent of the time. Except for the short-term adverse conditions in the equity markets in 2008, our recent three-year average rates of return have exceeded 10.0 percent. As a result, based on the historical returns and forward-looking return expectations, we believe an investment return assumption of 8.25 percent per year for U.S. pension assets is reasonable. The methodology used to determine the rate of return on pension plan assets in the U.K. was based on establishing an equity-risk premium over current long-term bond yields adjusted based on target asset allocations. Our strategy with respect to our investments in pension plan assets is to be invested with a long-term outlook. Therefore, the risk and return balance of our asset portfolio should reflect a long-term horizon. Our pension plan asset allocation at December 31, 2008 and 2007 and target allocation for 2009 are as follows:
| |
|
Percentage of Plan Assets at December 31, |
|||||||||
|---|---|---|---|---|---|---|---|---|---|---|---|
| |
Target Allocation 2009 |
||||||||||
Investment description
|
2008 | 2007 | |||||||||
Equity securities |
55-60 | % | 56.0 | % | 63.5 | % | |||||
Fixed income |
30-35 | % | 39.6 | % | 32.3 | % | |||||
Real estate/Other |
7-10 | % | 4.4 | % | 4.2 | % | |||||
Total |
100.0 | % | 100.0 | % | |||||||
Actual cash funding for our pension plans is governed by employee benefit and tax laws and the Pension Protection Act of 2006 ("the Act"). The Act extends the use of an average corporate bond rate for determining current liabilities for funding purposes. Among its many provisions, the Act establishes a 100 percent funding target for plan years beginning after December 31, 2007, which has now been extended by the U.S. Congress due to the recession. Our funding strategy is to make contributions to our various qualified plans in accordance with statutory funding requirements and any additional
57
contributions we determine are appropriate. The table below sets forth our pension contributions for the period 2007-2008 and our expected range of contributions for 2009.
| |
2009 | 2008 | 2007 | |||||||
|---|---|---|---|---|---|---|---|---|---|---|
Contributions (in millions) |
$ | 125-135 | $ | 102 | $ | 250 | ||||
Contributions beyond 2009 will depend on the funded status of our plans at that time in relation to the targeted funding established under the Act.
Our qualified pension plans in the U.S. and outside the U.S. were under-funded at December 31, 2008, by a total of $581 million due to pension trust asset performance.
Under SFAS 158, the actuarial gains and losses and prior service costs (credits) are recognized and recorded in accumulated other comprehensive loss. Increases in actuarial losses reduced our shareholders' equity by $445 million (after tax) in 2008. The increases resulted from plan asset performance in 2008.
Note 11 to the Consolidated Financial Statements provides a summary of our pension benefit plan activity, the funded status of our plans and the amounts recognized in our Consolidated Financial Statements.
Annual Assessment for Recoverability of Goodwill
Under the provisions of SFAS No. 142, "Goodwill and Other Intangible Assets" (SFAS 142), the carrying value of goodwill is reviewed annually. The fair value of each reporting unit was estimated by discounting the future cash flows less requirements for working capital and fixed asset additions. Our valuation method requires us to make projections of revenue, operating expenses, working capital investment and fixed asset additions for the reporting units over a multi-year period. Additionally, management must estimate its weighted-average cost of capital for each reporting unit for use as a discount rate. The discounted cash flows are compared to the carrying value of the reporting unit and, if less than the carrying value, a separate valuation of the goodwill is required to determine if an impairment loss has occurred. As of the end of the third quarter in 2008, we performed the annual impairment assessment required by SFAS 142 and determined that our goodwill was not impaired. At December 31, 2008, our recorded goodwill was $362 million. Changes in our projections or estimates, a deterioration of our operating results and the related cash flow effect or a significant increase in the discount rate could decrease the estimated fair value of our reporting units and result in a future impairment of goodwill.
RECENTLY ADOPTED AND RECENTY ISSUED ACCOUNTING PRONOUNCEMENTS
Accounting Pronouncements Recently Adopted
In July 2006, the Financial Accounting Standards Board (FASB) issued FASB Interpretation (FIN) No. 48, "Accounting for Uncertainty in Income Taxes—an interpretation of FASB Statement No. 109" (FIN 48), which prescribes a recognition threshold and measurement process for recording in the financial statements, uncertain tax positions taken or expected to be taken in a tax return. In addition, FIN 48 provides guidance on the derecognition, classification, accounting in interim periods and disclosure requirements for uncertain tax positions. The adoption of FIN 48, effective January 1, 2007, did not have a material effect on our Consolidated Financial Statements. See Note 4 to the Consolidated Financial Statements for further information regarding the adoption of this standard.
In September 2006, the FASB issued SFAS No. 157, "Fair Value Measurements" (SFAS 157), which defines fair value, establishes a framework for measuring fair value and expands disclosures about fair value measurements. The adoption of SFAS 157, effective January 1, 2008, did not have a material impact on our Consolidated Financial Statements. See Note 6 to the Consolidated Financial Statements for further information regarding the adoption of this standard.
58
In September 2006, the FASB issued SFAS No. 158, "Employers' Accounting for Defined Benefit Pension and Other Postretirement Plans—an amendment of FASB Statements No. 87, 88, 106 and 132(R)" (SFAS 158). This statement requires balance sheet recognition of the overfunded or underfunded status of pension and postretirement benefit plans. In addition, the measurement date (the date at which plan assets and the benefit obligation are measured) is required to be the company's fiscal year end. During 2006, we adopted the provisions (except for the measurement date change) of SFAS 158, "Employers' Accounting for Defined Benefit Pension and Other Postretirement Plans—an amendment of FASB Statements No. 87, 88, 106 and 132(R)," which resulted in a $94 million non-cash charge to equity. We adopted the measurement date provisions of SFAS 158 effective January 1, 2008. The majority of our pension and postretirement plans previously used a November 30 measurement date. All plans are now measured at December 31, consistent with the company's fiscal year end. The non-cash effect of the adoption of the measurement date provisions of SFAS 158 decreased shareholders' equity by approximately $10 million ($7 million after-tax) and increased long-term liabilities by approximately $10 million. There was no effect on our results of operations. See Note 11 to the Consolidated Financial Statements for further information regarding the adoption of this standard.
Accounting Pronouncements Issued But Not Yet Effective
In December 2007, the FASB issued SFAS No. 141 (revised 2007), "Business Combinations" (SFAS 141R), which is effective for fiscal years beginning after December 15, 2008. SFAS 141R makes significant changes to both the accounting and disclosures related to the acquisition of a business and could materially impact how we account for future business combination transactions. Because the standard will only impact transactions entered into after January 1, 2009, SFAS 141R will not impact our Consolidated Financial Statements upon adoption.
In December 2007, the FASB issued SFAS No. 160, "Noncontrolling Interests in Consolidated Financial Statements" (SFAS 160), which is effective for fiscal years beginning after December 15, 2008. SFAS 160 amends Accounting Research Bulletin No. 51, "Consolidated Financial Statements" (ARB 51) and establishes accounting and reporting standards for the noncontrolling interest in a subsidiary and for the deconsolidation of a subsidiary. For Cummins, the most significant impact of the standard, at adoption, will be to reclass a majority of our minority interests ($250 million at December 31, 2008) to be included as a part of equity, which may affect certain performance and equity ratios. We are currently evaluating the potential additional impact that SFAS 160 may have on our Consolidated Financial Statements.
In March 2008, the FASB issued SFAS No. 161, "Disclosures about Derivative Instruments and Hedging Activities" (SFAS 161), which is effective for fiscal years beginning after November 15, 2008. SFAS 161 amends SFAS No. 133, "Accounting for Derivative Instruments and Hedging Activities" (SFAS 133) and requires enhanced disclosures about a company's derivative and hedging activities. We do not expect the adoption of SFAS 161 to have a material impact on our Consolidated Financial Statements, but are still evaluating the additional disclosure requirements.
Item 7A. Quantitative and Qualitative Disclosures About Market Risk
We are exposed to financial risk resulting from volatility in foreign exchange rates, interest rates and commodity prices. This risk is closely monitored and managed through the use of financial derivative instruments including commodity forward contracts, currency forward contracts and interest rate swaps. As stated in our policies and procedures, financial derivatives are used expressly for hedging purposes, and under no circumstances are they used for speculation purposes. When material, we adjust the value of our derivative contracts for counter-party or our credit risk. The results and status of our hedging transactions are reported to senior management on a monthly and quarterly basis.
59
Further information regarding financial instruments and risk management is contained in Note 18 to the Consolidated Financial Statements.
The following describes our risk exposures and provides results of sensitivity analysis performed as of December 31, 2008. The sensitivity analysis assumes instantaneous, parallel shifts in foreign currency exchange rates and commodity prices.
As a result of our international business presence, we are exposed to foreign currency exchange risk. We transact in foreign currencies and have significant assets and liabilities denominated in foreign currencies. As a result, our income experiences some volatility related to movements in foreign currency exchange rates. In order to benefit from global diversification and after considering naturally offsetting currency positions, we enter into forward contracts to minimize our existing exposures (recognized asset and liability) and hedge forecasted transactions. The objective of our hedging program is to reduce the impact of changes in foreign exchange rates on income by essentially creating offsetting currency exposures.
As of December 31, 2008, the potential gain or loss in the fair value of our outstanding foreign currency contracts, assuming a hypothetical 10 percent fluctuation in the currencies of such contracts, would be approximately $68 million. The sensitivity analysis of the effects of changes in foreign currency exchange rates assumes the notional value to remain constant for the next 12 months. The analysis ignores the impact of foreign exchange movements on our competitive position and potential changes in sales levels. It should be noted that any change in the value of the contracts, real or hypothetical, would be significantly offset by an inverse change in the value of the underlying hedged items (see Note 18 to the Consolidated Financial Statements).
We are also exposed to interest rate risk as a result of our indebtedness. Our objective in managing our exposure to changes in interest rates is to limit the effect of interest rate changes on income and cash flows and to lower our overall cost of borrowing. To achieve this objective, we primarily use interest rate swap agreements to manage exposure to interest rate changes related to our borrowing arrangements.
In November 2005, we entered into an interest rate swap to effectively convert our $250 million, due in 2028, debt from a fixed rate of 7.125% to a floating rate based on a LIBOR spread. The terms of the swap mirror those of the debt, with interest paid semi-annually. This swap qualifies as a fair value hedge under SFAS No. 133, "Accounting for Derivative Instruments and Hedging Activities."
We are also exposed to fluctuations in commodity prices through the purchase of raw materials as well as contractual agreements with component suppliers. To reduce the effect of raw material price changes for select commodities, we periodically enter into commodity forward contracts with designated banks to hedge a portion of our anticipated raw material purchases.
As of December 31, 2008, the potential gain or loss related to the outstanding commodity forward contracts, assuming a hypothetical 10 percent fluctuation in the price of such commodities, was $10 million. The sensitivity analysis of the effects of changes in commodity prices assumes the notional value to remain constant for the next 12 months. The analysis ignores the impact of commodity price movements on our competitive position and potential changes in sales levels. It should be noted that any change in the value of the forward contracts, real or hypothetical, would be significantly offset by
60
an inverse change in the value of the underlying hedged items (see Note 18 to the Consolidated Financial Statements).
Item 8. Financial Statements and Supplementary Data
See Item 15 (a) for an index to the Consolidated Financial Statements.
Item 9. Changes in and Disagreements with Accountants on Accounting and Financial Disclosure
None.
Item 9A. Controls and Procedures
Evaluation of Disclosure Controls and Procedures
As of the end of the period covered by this Annual Report on Form 10-K, the Company carried out an evaluation under the supervision and with the participation of the Company's management, including the Chief Executive Officer and Chief Financial Officer of the effectiveness of the design and operation of the Company's disclosure controls and procedures as defined in Exchange Act Rules 13a-15(e) and 15d-15(e). Based upon that evaluation, the Chief Executive Officer and the Chief Financial Officer concluded that the Company's disclosure controls and procedures were effective to ensure that the information required to be disclosed by the Company in the reports that it files or submits under the Securities Exchange Act of 1934 is (1) recorded, processed, summarized and reported within the time periods specified in the Securities and Exchange Commission's rules and forms, and (2) accumulated and communicated to management, including the Chief Executive Officer and Chief Financial Officer, to allow timely decisions regarding required disclosure.
Changes in Internal Control over Financial Reporting
There has been no change in the Company's internal control over financial reporting during the quarter ended December 31, 2008, that has materially affected, or is reasonably likely to materially affect, the Company's internal control over financial reporting.
Management's Report on Internal Control Over Financial Reporting
Management is responsible for establishing and maintaining adequate internal control over financial reporting. The Company's internal control over financial reporting is a process designed to provide reasonable assurance regarding the reliability of financial reporting and preparation of the Company's Consolidated Financial Statements for external purposes in accordance with accounting principles generally accepted in the United States of America.
The Company's internal control over financial reporting includes those policies and procedures that:
61
Internal control over financial reporting is a process that involves human diligence and compliance and is subject to lapses in judgment and breakdowns resulting from human failures. Internal control over financial reporting can be circumvented by collusion or improper management override. Because of such limitations, there is a risk that material misstatements may not be prevented or detected on a timely basis by internal control over financial reporting. However, these inherent limitations are known features of the financial reporting process. It is possible to design into the process safeguards to reduce, though not eliminate, the risk material misstatements may not be prevented or detected on a timely basis. Also, projections of any evaluation of effectiveness to future periods are subject to the risk that controls may become inadequate because of changes in conditions, or the degree of compliance with policies or procedures may deteriorate.
Management assessed the effectiveness of the Company's internal control over financial reporting and concluded it was effective as of December 31, 2008. In making its assessment, management utilized the criteria set forth by the Committee of Sponsoring Organizations of the Treadway Commission in Internal Control—Integrated Framework.
PricewaterhouseCoopers LLP, an independent registered public accounting firm, audited the Company's financial statements included in this annual report and has issued an attestation report on the Company's internal control over financial reporting which appears herewith in this Form 10-K.
None.
62
Item 10. Directors and Executive Officers of the Registrant
The information required by Item 10 relating to identification of directors is incorporated by reference from "Election of Directors" in our Proxy Statement. Except as otherwise specifically incorporated by reference, the Proxy Statement is not deemed to be filed as part of this report.
Following are the names and ages of the executive officers of Cummins Inc., their positions with us as of January 31, 2009, and summaries of their backgrounds and business experience:
Name and Age
|
Present Cummins Inc. position and year appointed to position |
Principal position during the past five years other than Cummins Inc. position currently held |
||
|---|---|---|---|---|
| Theodore M. Solso (61) | Chairman of the Board of Directors and Chief Executive Officer (2000) | |||
N. Thomas Linebarger (46) |
President and Chief Operating Officer (2008) |
Executive Vice President and President—Power Generation (2005-2008), Vice President and President Cummins Power Generation (2003-2005) |
||
Pamela L. Carter (59) |
Vice President and President—Distribution Business (2008) |
President—Cummins Filtration (2006-2008), President—Fleetguard (2005-2006), Vice President—WW Sales, Marketing and Logistics—Fleetguard (2001-2005) |
||
Steven M. Chapman (54) |
Group Vice President—Emerging Markets and Businesses (2005) |
Vice President—International and President International Distributor Business (2002-2005) |
||
Richard J. Freeland (51) |
Vice President and President—Components Group (2008) |
Vice President and President—Worldwide Distribution Business (2005-2008), Vice President and General Manager—PowerCare and Distribution (2004-2005), Vice President and General Manager—Fuel Systems Business and Purchasing (2001-2004) |
||
Mark R. Gerstle (53) |
Vice President—Corporate Quality and Chief Risk Officer (2005) |
Vice President—Corporate/ Cummins Business Services and Corporate Quality (2004-2005), Vice President—Operations, Filtration Business Unit (2001-2004) |
||
Richard E. Harris (56) |
Vice President—Chief Investment Officer (2008) |
Vice President—Treasurer (2003-2008) |
63
Name and Age
|
Present Cummins Inc. position and year appointed to position |
Principal position during the past five years other than Cummins Inc. position currently held |
||
|---|---|---|---|---|
| Marsha L. Hunt (45) | Vice President—Corporate Controller (2003) | |||
James D. Kelly (56) |
Vice President and President—Engine Business (2005) |
Vice President and General Manager—Mid-range and Heavy-Duty Engine Business (2004-2005), Vice President and General Manager—Mid-range Engine Business (2001-2004) |
||
Marya M. Rose (46) |
Vice President—General Counsel (2001) |
|||
Livingston L. Satterthwaite (48) |
Vice President and President—Power Generation (2008) |
Vice President—Generator Set Business (2003-2008) |
||
John C. Wall (57) |
Vice President—Chief Technical Officer (2000) |
|||
Patrick J. Ward (45) |
Vice President—Chief Financial Officer (2008) |
Vice President—Engine Business Controller (2005-2008), Executive Director—Power Generation Business Controller (2003-2005) |
The Chairman and Chief Executive Officer is elected annually by the Board of Directors and holds office until the first meeting of the Board of Directors following the annual meeting of the shareholders. Other officers are appointed by the Chairman and Chief Executive Officer, are ratified by the Board of Directors and hold office for such period as the Chairman and Chief Executive Officer or the Board of Directors may prescribe.
Item 11. Executive Compensation
The information in the Proxy Statement under the caption "Executive Compensation" and "Summary Compensation Table" is incorporated by reference.
Item 12. Security Ownership of Certain Beneficial Owners and Management and Related Stockholder Matters
Item 13. Certain Relationships and Related Transactions
The information in the Proxy Statement under the caption "The Board of Directors and Its Committees," "Executive Compensation" and "Other Transactions and Agreements with Directors and Officers" is incorporated by reference.
64
Item 14. Principal Accountant Fees and Services
The information required by Item 14 is incorporated by reference from the information under the caption "Selection of Independent Public Accountants" in the Proxy Statement.
Item 15. Exhibits and Financial Statement Schedules
Index to Financial Statements
65
MANAGEMENT'S REPORT TO SHAREHOLDERS
Management's Report on Financial Statements and Practices
The accompanying Consolidated Financial Statements of Cummins Inc, (the "Company") were prepared by management, which is responsible for their integrity and objectivity. The statements were prepared in accordance with generally accepted accounting principles and include amounts that are based on management's best judgments and estimates. The other financial information included in the annual report is consistent with that in the financial statements.
Management also recognizes its responsibility for conducting the Company's affairs according to the highest standards of personal and corporate conduct. This responsibility is characterized and reflected in key policy statements issued from time to time regarding, among other things, conduct of its business activities within the laws of the host countries in which the Company operates, within The Foreign Corrupt Practices Act and potentially conflicting interests of its employees. The Company maintains a systematic program to assess compliance with these policies.
To comply with the requirements of Section 404 of the Sarbanes-Oxley Act of 2002, the Company designed and implemented a structured and comprehensive compliance process to evaluate its internal control over financial reporting across the enterprise.
Management's Report on Internal Control Over Financial Reporting
Management is responsible for establishing and maintaining adequate internal control over financial reporting. The Company's internal control over financial reporting is a process designed to provide reasonable assurance regarding the reliability of financial reporting and preparation of the Company's Consolidated Financial Statements for external purposes in accordance with accounting principles generally accepted in the United States of America.
The Company's internal control over financial reporting includes those policies and procedures that:
Internal control over financial reporting is a process that involves human diligence and compliance and is subject to lapses in judgment and breakdowns resulting from human failures. Internal control over financial reporting can be circumvented by collusion or improper management override. Because of such limitations, there is a risk that material misstatements may not be prevented or detected on a timely basis by internal control over financial reporting. However, these inherent limitations are known features of the financial reporting process. It is possible to design into the process safeguards to reduce, though not eliminate, the risk material misstatements may not be prevented or detected on a timely basis. Also, projections of any evaluation of effectiveness to future periods are subject to the risk that controls may become inadequate because of changes in conditions, or the degree of compliance with policies or procedures may deteriorate.
66
Management assessed the effectiveness of the Company's internal control over financial reporting and concluded it was effective as of December 31, 2008. In making its assessment, management utilized the criteria set forth by the Committee of Sponsoring Organizations of the Treadway Commission in Internal Control—Integrated Framework.
PricewaterhouseCoopers LLP, an independent registered public accounting firm, audited the Company's financial statements included in this annual report and has issued an attestation report on the Company's internal control over financial reporting which appears herewith in this Form 10-K.
Please refer to Exhibits 31(a) and 31(b) attached to this report for certifications required under Section 302 of the Sarbanes-Oxley Act of 2002.
| /s/ THEODORE M. SOLSO Chairman and Chief Executive Officer |
/s/ PATRICK J. WARD Vice President and Chief Financial Officer |
67
Report of Independent Registered Public Accounting Firm
To the Board of Directors and Shareholders of Cummins Inc.:
In our opinion, the accompanying consolidated financial statements listed in the index appearing under item 15(a)(1) present fairly, in all material respects, the financial position of Cummins Inc. and its subsidiaries at December 31, 2008 and 2007, and the results of their operations and their cash flows for each of the three years in the period ended December 31, 2008 in conformity with accounting principles generally accepted in the United States of America. In our opinion, the Company maintained, in all material respects, effective internal control over financial reporting as of December 31, 2008, based on criteria established in Internal Control—Integrated Framework issued by the Committee of Sponsoring Organizations of the Treadway Commission (COSO). The Company's management is responsible for these financial statements, for maintaining effective internal control over financial reporting and for its assessment of the effectiveness of internal control over financial reporting, included in "Management's Report on Internal Control over Financial Reporting" appearing under Item 9A. Our responsibility is to express opinions on these financial statements and on the Company's internal control over financial reporting based on our integrated audits. We conducted our audits in accordance with the standards of the Public Company Accounting Oversight Board (United States). Those standards require that we plan and perform the audits to obtain reasonable assurance about whether the financial statements are free of material misstatement and whether effective internal control over financial reporting was maintained in all material respects. Our audits of the financial statements included examining, on a test basis, evidence supporting the amounts and disclosures in the financial statements, assessing the accounting principles used and significant estimates made by management, and evaluating the overall financial statement presentation. Our audit of internal control over financial reporting included obtaining an understanding of internal control over financial reporting, assessing the risk that a material weakness exists, and testing and evaluating the design and operating effectiveness of internal control based on the assessed risk. Our audits also included performing such other procedures as we considered necessary in the circumstances. We believe that our audits provide a reasonable basis for our opinions.
As described in Note 1 to the consolidated financial statements, the Company changed the manner in which it accounts for pension and other postretirement benefits in 2006. As described in Note 4 to the consolidated financial statements, the Company changed the manner in which it accounts for uncertain tax positions in 2007.
A company's internal control over financial reporting is a process designed to provide reasonable assurance regarding the reliability of financial reporting and the preparation of financial statements for external purposes in accordance with generally accepted accounting principles. A company's internal control over financial reporting includes those policies and procedures that (i) pertain to the maintenance of records that, in reasonable detail, accurately and fairly reflect the transactions and dispositions of the assets of the company; (ii) provide reasonable assurance that transactions are recorded as necessary to permit preparation of financial statements in accordance with generally accepted accounting principles, and that receipts and expenditures of the company are being made only in accordance with authorizations of management and directors of the company; and (iii) provide reasonable assurance regarding prevention or timely detection of unauthorized acquisition, use, or disposition of the company's assets that could have a material effect on the financial statements.
Because of its inherent limitations, internal control over financial reporting may not prevent or detect misstatements. Also, projections of any evaluation of effectiveness to future periods are subject to the risk that controls may become inadequate because of changes in conditions, or that the degree of compliance with the policies or procedures may deteriorate.
/s/ PricewaterhouseCoopers LLP
Indianapolis,
Indiana
February 27, 2009
68
CUMMINS INC. AND SUBSIDIARIES
CONSOLIDATED STATEMENTS OF INCOME
| |
Years ended December 31, | ||||||||||
|---|---|---|---|---|---|---|---|---|---|---|---|
| |
2008 | 2007 | 2006 | ||||||||
| |
in millions (except per share amounts) |
||||||||||
Net sales(a) |
$ | 14,342 | $ | 13,048 | $ | 11,362 | |||||
Cost of sales |
11,402 | 10,492 | 8,897 | ||||||||
Gross margin |
2,940 | 2,556 | 2,465 | ||||||||
Operating expenses and income |
|||||||||||
Selling, general and administrative expenses |
1,450 | 1,296 | 1,153 | ||||||||
Research, development and engineering expenses |
422 | 329 | 321 | ||||||||
Equity, royalty and interest income from investees (Note 2) |
253 | 205 | 140 | ||||||||
Restructuring charges (Note 3) |
37 | — | — | ||||||||
Other operating (expense) income, net |
(12 | ) | 22 | — | |||||||
Operating income |
1,272 | 1,158 | 1,131 | ||||||||
Interest income |
18 |
36 |
47 |
||||||||
Interest expense (Note 10) |
42 | 58 | 96 | ||||||||
Other (expense) income, net (Note 23) |
(70 | ) | 33 | 1 | |||||||
Income before income taxes and minority interests |
1,178 | 1,169 | 1,083 | ||||||||
Income tax expense (Note 4) |
360 |
381 |
324 |
||||||||
Minority interests in income of consolidated subsidiaries |
63 | 49 | 44 | ||||||||
Net income |
$ | 755 | $ | 739 | $ | 715 | |||||
Earnings per common share (Note 17) |
|||||||||||
Basic |
$ | 3.87 | $ | 3.72 | $ | 3.76 | |||||
Diluted |
$ | 3.84 | $ | 3.70 | $ | 3.55 | |||||
The accompanying notes are an integral part of the Consolidated Financial Statements.
69
CUMMINS INC. AND SUBSIDIARIES
CONSOLIDATED BALANCE SHEETS
| |
December 31, | |||||||||
|---|---|---|---|---|---|---|---|---|---|---|
| |
2008 | 2007 | ||||||||
| |
in millions (except par value) |
|||||||||
Assets |
||||||||||
Current assets |
||||||||||
Cash and cash equivalents |
$ | 426 | $ | 577 | ||||||
Marketable securities (Note 5) |
77 | 120 | ||||||||
Accounts and notes receivable, net |
||||||||||
Trade and other |
1,551 | 1,754 | ||||||||
Nonconsolidated equity investees |
231 | 244 | ||||||||
Inventories (Note 7) |
1,783 | 1,692 | ||||||||
Deferred income taxes (Note 4) |
347 | 276 | ||||||||
Prepaid expenses and other current assets |
298 | 152 | ||||||||
Total current assets |
4,713 | 4,815 | ||||||||
Long-term assets |
||||||||||
Property, plant and equipment (Note 8) |
4,539 | 4,313 | ||||||||
Accumulated depreciation |
(2,698 | ) | (2,668 | ) | ||||||
Property, plant and equipment, net |
1,841 | 1,645 | ||||||||
Investments and advances related to equity method investees (Note 2) |
588 | 514 | ||||||||
Goodwill and other intangible assets, net (Note 9) |
585 | 538 | ||||||||
Deferred income taxes (Note 4) |
491 | 271 | ||||||||
Other assets |
301 | 412 | ||||||||
Total assets |
$ | 8,519 | $ | 8,195 | ||||||
Liabilities |
||||||||||
Current liabilities |
||||||||||
Current portion of long-term debt and loans payable (Note 10) |
$ | 69 | $ | 119 | ||||||
Accounts payable (principally trade) |
1,009 | 1,263 | ||||||||
Current portion of accrued product warranty (Note 12) |
434 | 337 | ||||||||
Accrued compensation, benefits and retirement costs |
364 | 441 | ||||||||
Other accrued expenses |
763 | 551 | ||||||||
Total current liabilities |
2,639 | 2,711 | ||||||||
Long-term liabilities |
||||||||||
Long-term debt (Note 10) |
629 | 555 | ||||||||
Pensions (Note 11) |
574 | 140 | ||||||||
Postretirement benefits other than pensions (Note 11) |
452 | 493 | ||||||||
Other liabilities and deferred revenue |
745 | 594 | ||||||||
Total liabilities |
5,039 | 4,493 | ||||||||
Commitments and contingencies (Note 13) |
— | — | ||||||||
Minority interests (Note 14) |
250 |
293 |
||||||||
Shareholders' equity (Note 15) |
||||||||||
Common stock, $2.50 par value, 500 and 300 shares authorized, 221.7 and 220.4 shares issued |
1,793 | 1,719 | ||||||||
Retained earnings |
3,288 | 2,660 | ||||||||
Treasury stock, at cost, 20.4 and 18.2 shares |
(715 | ) | (593 | ) | ||||||
Common stock held by employee benefits trust, at cost, 5.1 and 6.5 shares |
(61 | ) | (79 | ) | ||||||
Unearned compensation |
(5 | ) | (11 | ) | ||||||
Accumulated other comprehensive loss |
||||||||||
Defined benefit postretirement plans |
(798 | ) | (378 | ) | ||||||
Other |
(272 | ) | 91 | |||||||
Total accumulated other comprehensive loss |
(1,070 | ) | (287 | ) | ||||||
Total shareholders' equity |
3,230 | 3,409 | ||||||||
Total liabilities, minority interests and shareholders' equity |
$ | 8,519 | $ | 8,195 | ||||||
The accompanying notes are an integral part of the Consolidated Financial Statements.
70
CUMMINS INC. AND SUBSIDIARIES
CONSOLIDATED STATEMENTS OF CASH FLOWS
| |
Years ended December 31, | |||||||||||
|---|---|---|---|---|---|---|---|---|---|---|---|---|
| |
2008 | 2007 | 2006 | |||||||||
| |
in millions |
|||||||||||
Cash flows from operating activities |
||||||||||||
Net income |
$ | 755 | $ | 739 | $ | 715 | ||||||
Adjustments to reconcile net income to net cash provided by operating activities: |
||||||||||||
Restructuring charges, net (Note 3) |
34 | — | — | |||||||||
Depreciation and amortization |
314 | 290 | 296 | |||||||||
Loss on investments |
45 | — | — | |||||||||
Deferred income tax (benefit) provision (Note 4) |
(1 | ) | 60 | 139 | ||||||||
Equity in income of investees, net of dividends |
(45 | ) | (75 | ) | (38 | ) | ||||||
Minority interests in income of consolidated subsidiaries |
63 | 49 | 44 | |||||||||
Pension expense (Note 11) |
71 | 98 | 120 | |||||||||
Pension contributions |
(102 | ) | (250 | ) | (266 | ) | ||||||
Other post-retirement benefits expense, net of cash payments |
(35 | ) | (28 | ) | (35 | ) | ||||||
Stock-based compensation expense (Note 16) |
28 | 28 | 18 | |||||||||
Excess tax benefits on stock-based awards |
(13 | ) | (11 | ) | (6 | ) | ||||||
Translation and hedging activities |
(10 | ) | (24 | ) | (26 | ) | ||||||
Changes in current assets and liabilities, net of acquisitions and dispositions (Note 1) |
(267 | ) | (139 | ) | (191 | ) | ||||||
Changes in long-term liabilities |
109 | 95 | 23 | |||||||||
Other, net |
41 | (22 | ) | 47 | ||||||||
Net cash provided by operating activities |
987 | 810 | 840 | |||||||||
Cash flows from investing activities |
||||||||||||
Capital expenditures |
(543 | ) | (353 | ) | (249 | ) | ||||||
Investments in internal use software |
(82 | ) | (67 | ) | (52 | ) | ||||||
Proceeds from disposals of property, plant and equipment |
29 | 44 | 49 | |||||||||
Investments in and advances to equity investees |
(89 | ) | (66 | ) | (18 | ) | ||||||
Acquisitions of businesses, net of cash acquired (Note 21) |
(142 | ) | (20 | ) | (2 | ) | ||||||
Proceeds from the sale of investments in businesses (Note 21) |
64 | 35 | 24 | |||||||||
Investments in marketable securities—acquisitions |
(390 | ) | (405 | ) | (303 | ) | ||||||
Investments in marketable securities—liquidations |
409 | 395 | 273 | |||||||||
Cash flows from derivatives not designated as hedges |
(53 | ) | (14 | ) | (8 | ) | ||||||
Purchase of other investments |
(62 | ) | (57 | ) | — | |||||||
Other, net |
11 | (7 | ) | 9 | ||||||||
Net cash used in investing activities |
(848 | ) | (515 | ) | (277 | ) | ||||||
Cash flows from financing activities |
||||||||||||
Proceeds from borrowings |
76 | 15 | 94 | |||||||||
Payments on borrowings and capital lease obligations |
(152 | ) | (144 | ) | (400 | ) | ||||||
Net borrowings under short-term credit agreements |
33 | (12 | ) | (3 | ) | |||||||
Distributions to minority shareholders |
(24 | ) | (18 | ) | (20 | ) | ||||||
Dividend payments on common stock |
(122 | ) | (89 | ) | (66 | ) | ||||||
Proceeds from sale of common stock held by employee benefits trust |
63 | 13 | — | |||||||||
Repurchases of common stock |
(128 | ) | (335 | ) | (121 | ) | ||||||
Excess tax benefits on stock-based awards |
13 | 11 | 6 | |||||||||
Other, net |
4 | (17 | ) | 2 | ||||||||
Net cash used in financing activities |
(237 | ) | (576 | ) | (508 | ) | ||||||
Effect of exchange rate changes on cash and cash equivalents |
(53 | ) | 18 | 6 | ||||||||
Net (decrease) increase in cash and cash equivalents |
(151 | ) | (263 | ) | 61 | |||||||
Cash and cash equivalents at beginning of year |
577 | 840 | 779 | |||||||||
Cash and cash equivalents at end of year |
$ | 426 | $ | 577 | $ | 840 | ||||||
The accompanying notes are an integral part of the Consolidated Financial Statements.
71
CUMMINS INC. AND SUBSIDIARIES
CONSOLIDATED STATEMENTS OF SHAREHOLDERS' EQUITY
| |
Common Stock |
Additional paid-in Capital |
Retained Earnings |
Accumulated Other Comprehensive Loss |
Treasury Stock |
Common Stock Held in Trust |
Unearned Compensation |
Total Shareholders' Equity |
|||||||||||||||||||
|---|---|---|---|---|---|---|---|---|---|---|---|---|---|---|---|---|---|---|---|---|---|---|---|---|---|---|---|
| |
in millions |
||||||||||||||||||||||||||
Balance at December 31, 2005 |
$ | 121 | $ | 1,201 | $ | 1,360 | $ | (603 | ) | $ | (101 | ) | $ | (97 | ) | $ | (17 | ) | $ | 1,864 | |||||||
Comprehensive income: |
|||||||||||||||||||||||||||
Net income |
715 | 715 | |||||||||||||||||||||||||
Other comprehensive income (loss): |
|||||||||||||||||||||||||||
Unrealized loss on marketable securities |
(1 | ) | (1 | ) | |||||||||||||||||||||||
Unrealized gain on derivatives |
7 | 7 | |||||||||||||||||||||||||
Foreign currency translation adjustments |
63 | 63 | |||||||||||||||||||||||||
Minimum pension liability adjustments |
102 | 102 | |||||||||||||||||||||||||
Total comprehensive income |
886 | ||||||||||||||||||||||||||
Issuance of shares |
1 | 10 | 10 | 21 | |||||||||||||||||||||||
Acquisition of shares |
(121 | ) | (121 | ) | |||||||||||||||||||||||
Cash dividends on common stock |
(66 | ) | (66 | ) | |||||||||||||||||||||||
Stock option exercises |
1 | 1 | |||||||||||||||||||||||||
Adjustment to initially apply SFAS No. 158 |
(94 | ) | (94 | ) | |||||||||||||||||||||||
Debt conversion |
15 | 276 | 291 | ||||||||||||||||||||||||
Other shareholder transactions |
12 | 5 | 3 | 20 | |||||||||||||||||||||||
Balance at December 31, 2006 |
137 | 1,500 | 2,009 | (526 | ) | (212 | ) | (92 | ) | (14 | ) | 2,802 | |||||||||||||||
Comprehensive income: |
|||||||||||||||||||||||||||
Net income |
739 | 739 | |||||||||||||||||||||||||
Other comprehensive income (loss): |
|||||||||||||||||||||||||||
Unrealized gain on marketable securities |
4 | 4 | |||||||||||||||||||||||||
Unrealized loss on derivatives |
(5 | ) | (5 | ) | |||||||||||||||||||||||
Foreign currency translation adjustments |
107 | 107 | |||||||||||||||||||||||||
Change in pensions and other postretirement defined benefit plans |
133 | 133 | |||||||||||||||||||||||||
Total comprehensive income |
978 | ||||||||||||||||||||||||||
Issuance of shares |
1 | 8 | 6 | 15 | |||||||||||||||||||||||
Stock splits |
413 | (413 | ) | — | |||||||||||||||||||||||
Employee benefits trust activity |
52 | (52 | ) | 13 | 13 | ||||||||||||||||||||||
Acquisition of shares |
(335 | ) | (335 | ) | |||||||||||||||||||||||
Cash dividends on common stock |
(89 | ) | (89 | ) | |||||||||||||||||||||||
Stock option exercises |
1 | 1 | |||||||||||||||||||||||||
Other shareholder transactions |
20 | 1 | 3 | 24 | |||||||||||||||||||||||
Balance at December 31, 2007 |
551 | 1,168 | 2,660 | (287 | ) | (593 | ) | (79 | ) | (11 | ) | 3,409 | |||||||||||||||
Comprehensive income: |
|||||||||||||||||||||||||||
Net income |
755 | 755 | |||||||||||||||||||||||||
Other comprehensive loss: |
|||||||||||||||||||||||||||
Unrealized loss on marketable securities |
(4 | ) | (4 | ) | |||||||||||||||||||||||
Unrealized loss on derivatives |
(70 | ) | (70 | ) | |||||||||||||||||||||||
Foreign currency translation adjustments |
(289 | ) | (289 | ) | |||||||||||||||||||||||
Change in pensions and other postretirement defined benefit plans |
(418 | ) | (418 | ) | |||||||||||||||||||||||
Total comprehensive loss |
(26 | ) | |||||||||||||||||||||||||
Effect of changing pension plan measurement date pursuant to SFAS No. 158 |
(5 | ) | (2 | ) | (7 | ) | |||||||||||||||||||||
Issuance of shares |
3 | 4 | 7 | ||||||||||||||||||||||||
Employee benefits trust activity |
46 | 18 | 64 | ||||||||||||||||||||||||
Acquisition of shares |
(128 | ) | (128 | ) | |||||||||||||||||||||||
Cash dividends on common stock |
(122 | ) | (122 | ) | |||||||||||||||||||||||
Stock option exercises |
(1 | ) | 6 | 5 | |||||||||||||||||||||||
Other shareholder transactions |
22 | 6 | 28 | ||||||||||||||||||||||||
Balance at December 31, 2008 |
$ | 554 | $ | 1,239 | $ | 3,288 | $ | (1,070 | )(1) | $ | (715 | ) | $ | (61 | ) | $ | (5 | ) | $ | 3,230 | |||||||
The accompanying notes are an integral part of the Consolidated Financial Statements.
72
CUMMINS INC. AND SUBSIDIARIES
NOTES TO CONSOLIDATED FINANCIAL STATEMENTS
NOTE 1. SUMMARY OF SIGNIFICANT ACCOUNTING POLICIES
Cummins Inc. ("Cummins," "the Company," "the registrant," "we," "our," or "us") is a leading global power provider that designs, manufactures, distributes and services diesel and natural gas engines, electric power generation systems and engine-related component products, including filtration and emissions solutions, fuel systems, controls and air handling systems. We were founded in 1919 as one of the first manufacturers of diesel engines and are headquartered in Columbus, Indiana. We sell our products to Original Equipment Manufacturers (OEMs), distributors and other customers worldwide. We serve our customers through a network of more than 500 company-owned and independent distributor locations and approximately 5,200 dealer locations in more than 190 countries and territories.
Our Consolidated Financial Statements include the accounts of all wholly-owned and majority-owned domestic and foreign subsidiaries where our ownership is more than 50 percent of common stock except for majority-owned subsidiaries that are considered Variable Interest Entities (VIEs) where we are not deemed the primary beneficiary. In addition, we also consolidate, regardless of our ownership percentage, VIEs for which we are deemed to be the primary beneficiary. Intercompany balances and transactions are eliminated in consolidation. Where our ownership interest is less than 100 percent, the minority ownership interests are reported in our Consolidated Balance Sheets. The minority ownership interest in our income, net of tax, is classified as "Minority interests in income of consolidated subsidiaries" in our Consolidated Statements of Income.
Certain amounts for 2007 and 2006 have been reclassified to conform to the 2008 classifications. All share amounts and per share amounts have been adjusted for the impact of a two-for-one stock split on April 9, 2007 and an additional two-for-one stock split on January 2, 2008.
Investments in Equity Investees
We use the equity method to account for our investments in joint ventures, affiliated companies and alliances in which we have the ability to exercise significant influence, generally represented by common stock ownership or partnership equity of at least 20 percent but not more than 50 percent. Generally, under the equity method, original investments in these entities are recorded at cost and subsequently adjusted by our share of equity in income or losses after the date of acquisition. Investment amounts in excess of our share of an investee's assets are amortized over the life of the related asset creating the excess. If the excess is goodwill, then it is not amortized. Equity in income or losses of each investee is recorded according to our level of ownership; if losses accumulate, we record our share of losses until our investment has been fully depleted. If our investment has been fully depleted, we recognize additional losses only when we are the primary funding source. We eliminate (to the extent of our ownership percentage) in our Consolidated Financial Statements the profit in inventory held by our equity method investees that has not yet been sold to a third-party. Our investments are classified as "Investments and advances related to equity method investees" in our Consolidated Balance Sheets. Our share of the results from joint ventures, affiliated companies and alliances is reported in our Consolidated Statements of Income as "Equity, royalty and interest income from investees," and is reported net of all applicable income taxes.
73
CUMMINS INC. AND SUBSIDIARIES
NOTES TO CONSOLIDATED FINANCIAL STATEMENTS (Continued)
NOTE 1. SUMMARY OF SIGNIFICANT ACCOUNTING POLICIES (Continued)
Our foreign equity investees are presented net of applicable foreign income taxes in the Consolidated Statements of Income. The vast majority of our U.S. equity investees are partnerships (non-taxable), thus there is no difference between gross or net of tax presentation as the investees are not taxed.
Use of Estimates in the Preparation of the Financial Statements
Preparation of financial statements in conformity with accounting principles generally accepted in the United States of America (GAAP) requires management to make estimates and assumptions that affect reported amounts presented and disclosed in our Consolidated Financial Statements. Significant estimates and assumptions in these Consolidated Financial Statements require the exercise of judgment and are used for, but not limited to, allowance for doubtful accounts, estimates of future cash flows and other assumptions associated with goodwill and long-lived asset impairment tests, useful lives for depreciation and amortization, warranty programs, determination of discount and other rate assumptions for pension and other postretirement benefit expenses, restructuring costs, income taxes and deferred tax valuation allowances, lease classification, and contingencies. Due to the inherent uncertainty involved in making estimates, actual results reported in future periods may be different from these estimates.
We recognize revenue, net of estimated costs of returns, allowances and sales incentives, when it is realized or realizable, which generally occurs when persuasive evidence of an arrangement exists, the product has been shipped and legal title and all risks of ownership have been transferred, customer acceptance has occurred and payment is reasonably assured. Products are generally sold on open account under credit terms customary to the geographic region of distribution. We perform ongoing credit evaluations of our customers and generally do not require collateral to secure our accounts receivable. For engines, service parts, service tools and other items sold to independent distributors and to partially-owned distributors accounted for under the equity method, revenues are recorded when title and risk of ownership transfers. This transfer is based on the agreement in effect with the respective distributor and in the United States (U.S.) and most international locations occurs generally when the products are shipped. To the extent of our ownership percentage, margins on sales to distributors accounted for under the equity method are deferred until the distributor sells the product to unrelated parties.
We provide various sales incentives to both our distribution network and our OEM customers. These programs are designed to promote the sale of our product in the channel or encourage the usage of our products by OEM customers. Sales incentives primarily fall into three categories: (1) volume rebates, (2) market share rebates, and (3) aftermarket rebates. For volume rebates, we provide certain customers with rebate opportunities for attaining specified volumes during a particular quarter or year. We accrue for the expected amount of these rebates at the time of the original sale and update our accruals quarterly based on our best estimate of the volume levels the customer will reach during the measurement period. For market share rebates, we provide certain customers with rebate opportunities based on the percentage of their production that utilizes a Cummins product. These rebates are typically measured either quarterly or annually and are accrued at the time of the original sale based on the current market shares, with adjustments made as the level changes. For aftermarket rebates we provide incentives to promote sales to certain dealers and end-markets. These
74
CUMMINS INC. AND SUBSIDIARIES
NOTES TO CONSOLIDATED FINANCIAL STATEMENTS (Continued)
NOTE 1. SUMMARY OF SIGNIFICANT ACCOUNTING POLICIES (Continued)
rebates are typically paid on a quarterly or more frequent basis and estimates are made at the end of each quarter as to the amount yet to be paid. These estimates are based on historical experience with the particular program. The incentives are classified as a reduction in sales in our Consolidated Statements of Income.
Rights of return do not exist for a large portion of our sales, other than for quality issues. We do offer certain return rights in our aftermarket business, where some aftermarket customers are permitted to return small amounts of parts and filters each year and in our power generation business, which sells portable generators to retail customers. An estimate of future returns is accrued at the time of sale based on historical return rates.
Foreign Currency Transactions and Translation
We translate assets and liabilities of foreign entities to U.S. dollars, where the local currency is the functional currency, at year-end exchange rates. We translate income and expenses to U.S. dollars using weighted-average exchange rates for the year. We record adjustments resulting from translation in a separate component of accumulated other comprehensive loss and include the adjustments in net income only upon sale or liquidation of the underlying foreign investment.
Foreign currency transaction gains and losses are included in current net income. For foreign entities where the U.S. dollar is the functional currency, including those operating in highly inflationary economies, we remeasure inventory, property, plant and equipment balances and the related income statement using historical exchange rates. We include the resulting gains and losses, including the effect of derivatives in the Consolidated Statements of Income, which combined with transaction gains and losses amounted to a net loss of $46 million in 2008, a net gain of $28 million in 2007 and a net gain of $11 million in 2006.
We make use of derivative instruments in foreign exchange, commodity price and interest rate hedging programs. Derivatives currently in use are foreign currency forward contracts, commodity forward contracts and an interest rate swap. These contracts are used strictly for hedging and not for speculative purposes.
As a result of our international business presence, we are exposed to foreign currency exchange risk. We transact in foreign currencies and have significant assets and liabilities denominated in foreign currencies. As a result, our income experiences some volatility related to movements in foreign currency exchange rates. In order to benefit from global diversification and after considering naturally offsetting currency positions, we enter into foreign currency forward contracts to minimize our existing exposures (recognized assets and liabilities) and hedge forecasted transactions.
We are exposed to fluctuations in commodity prices due to contractual agreements with component suppliers. In order to protect ourselves against future price volatility and, consequently, fluctuations in gross margins, we periodically enter into commodity forward contracts with designated banks to fix the cost of certain raw material purchases with the objective of minimizing changes in inventory cost due to market price fluctuations.
We record all derivatives at fair value in our financial statements. Note 18 provides further information on our hedging strategy and accounting for derivative financial instruments.
75
CUMMINS INC. AND SUBSIDIARIES
NOTES TO CONSOLIDATED FINANCIAL STATEMENTS (Continued)
NOTE 1. SUMMARY OF SIGNIFICANT ACCOUNTING POLICIES (Continued)
We determine our income tax provision using the asset and liability method. Under this method, deferred tax assets and liabilities are recognized for the expected future tax consequences of temporary differences between the financial statement carrying amounts of existing assets and liabilities and their respective tax bases. We also recognize future tax benefits associated with tax loss and credit carryforwards as deferred tax assets. Our deferred tax assets are reduced by a valuation allowance when, in the opinion of management, it is more likely than not that some portion or all of the deferred tax assets will not be realized. We measure deferred tax assets and liabilities using enacted tax rates in effect for the year in which we expect to recover or settle the temporary differences. The effect of a change in tax rates on deferred taxes is recognized in the period that the change is enacted. We reduce our net tax assets for the estimated additional tax and interest that may result from tax authorities disputing uncertain tax positions we have taken. During interim reporting periods our income tax provision is based upon the estimated annual effective tax rate of those taxable jurisdictions where we conduct business.
Cash equivalents are defined as short-term, highly liquid investments with an original maturity of 90 days or less at the time of purchase. The carrying amounts reflected in our Consolidated Balance Sheets for cash and cash equivalents approximate fair value due to the short-term maturity of these investments.
Statements of Cash Flows—Supplemental Disclosures
| |
Years ended December 31, | |||||||||
|---|---|---|---|---|---|---|---|---|---|---|
| |
2008 | 2007 | 2006 | |||||||
| |
in millions |
|||||||||
Changes in current assets and liabilities, net of acquisitions and dispositions, were as follows: |
||||||||||
Accounts and notes receivable |
$ | 88 | $ | (203 | ) | $ | (301 | ) | ||
Inventories |
(251 | ) | (255 | ) | (158 | ) | ||||
Other current assets |
(54 | ) | (34 | ) | (4 | ) | ||||
Accounts payable |
(174 | ) | 136 | 149 | ||||||
Accrued expenses |
124 | 217 | 123 | |||||||
Total |
(267 | ) | (139 | ) | (191 | ) | ||||
Cash payments for income taxes, net of refunds |
$ |
349 |
$ |
294 |
$ |
165 |
||||
Cash payments for interest, net of capitalized interest |
$ | 45 | $ | 57 | $ | 100 | ||||
During 2006, we incurred capital lease obligations of $58 million primarily due to the lease extension on the corporate headquarters building and computer equipment leases.
We account for marketable securities in accordance with the provisions of Statement of Financial Accounting Standards (SFAS) No. 115, "Accounting for Certain Investments in Debt and Equity
76
CUMMINS INC. AND SUBSIDIARIES
NOTES TO CONSOLIDATED FINANCIAL STATEMENTS (Continued)
NOTE 1. SUMMARY OF SIGNIFICANT ACCOUNTING POLICIES (Continued)
Securities." We determine the appropriate classification of all marketable securities as "held-to-maturity, "available-for-sale" or "trading" at the time of purchase, and re-evaluate such classifications at each balance sheet date. At December 31, 2008 and 2007, all of our investments were classified as available-for-sale.
Available-for-sale securities are carried at fair value with the unrealized gain or loss, net of tax, reported in other comprehensive income. Unrealized losses considered to be "other-than-temporary" are recognized currently in income. The cost of securities sold is based on the specific identification method. The fair value of most investment securities is determined by currently available market prices. Where quoted market prices are not available, we use the market price of similar types of securities that are traded in the market to estimate fair value. See Note 5 for a detailed description of our investments in marketable securities.
Accounts Receivable and Allowance for Doubtful Accounts
Trade accounts receivable are recorded at the invoiced amount, which approximates fair value, and generally do not bear interest. We have a trade receivables sales program, which is more fully discussed in Note 20, which allows us to sell, without recourse, an interest in a pool of our trade receivables to a financial institution as necessary. The allowance for doubtful accounts is our best estimate of the amount of probable credit losses in our existing accounts receivable. We determine the allowance based on our historical collection experience and by performing an analysis of our accounts receivable in light of the current economic environment. We review our allowance for doubtful accounts on a regular basis. In addition, when necessary, we provide an allowance for the full amount of specific accounts deemed to be uncollectible. Account balances are charged off against the allowance in the period in which we determine that it is probable the receivable will not be recovered. The activity in our allowance for doubtful accounts is as follows:
| |
December 31, | |||||||||
|---|---|---|---|---|---|---|---|---|---|---|
| |
2008 | 2007 | 2006 | |||||||
| |
in millions |
|||||||||
Balance, beginning of year |
$ | 12 | $ | 11 | $ | 16 | ||||
Provision for bad debts |
9 | 7 | 3 | |||||||
Write-offs |
(9 | ) | (7 | ) | (8 | ) | ||||
Other |
(2 | ) | 1 | — | ||||||
Balance, end of year |
$ | 10 | $ | 12 | $ | 11 | ||||
Our inventories are stated at the lower of cost or net realizable value. At December 31, 2008 and 2007, approximately 18 percent and 21 percent, respectively, of our consolidated inventories (primarily heavy-duty and high-horsepower engines and parts) were valued using the last-in, first-out (LIFO) cost method. The cost of other inventories is generally valued using the first-in, first-out (FIFO) cost method. Our inventories at interim and year-end reporting dates include estimates for adjustments related to annual physical inventory results and for inventory cost changes under the LIFO cost method. Due to significant movements of partially-manufactured components and parts between
77
CUMMINS INC. AND SUBSIDIARIES
NOTES TO CONSOLIDATED FINANCIAL STATEMENTS (Continued)
NOTE 1. SUMMARY OF SIGNIFICANT ACCOUNTING POLICIES (Continued)
manufacturing plants, we do not internally measure, nor do our accounting systems provide, a meaningful segregation between raw materials and work-in-process.
We record property, plant and equipment at cost. We depreciate the cost of the majority of engine production equipment using a modified units-of-production method, which is based upon units produced subject to a minimum level. We depreciate the cost of all other equipment using the straight-line method with depreciable lives ranging from 20 to 40 years for buildings and three to 20 years for machinery, equipment and fixtures. We expense normal maintenance and repair costs as incurred. Depreciation expense totaled $262 million, $256 million and $266 million for the years ended December 31, 2008, 2007 and 2006, respectively.
We review our long-lived assets for possible impairment whenever events or circumstances indicate that the carrying value of an asset or asset group may not be recoverable. We assess the recoverability of the carrying value of the long-lived assets at the lowest level for which identifiable cash flows are largely independent of the cash flows of other assets and liabilities. An impairment of a long-lived asset or asset group exists when the expected future pre-tax cash flows (undiscounted and without interest charges) estimated to be generated by the asset or asset group is less than its carrying value. If these cash flows are less than the carrying value of such asset or asset group, an impairment loss is measured based on the difference between the estimated fair value and carrying value of the asset or asset group. Assumptions and estimates used to estimate cash flows in the evaluation of impairment and the fair values used to determine the impairment are subject to a degree of judgment and complexity. Any changes to the assumptions and estimates resulting from changes in actual results or market conditions from those anticipated may affect the carrying value of long-lived assets and could result in an impairment charge.
Goodwill represents the excess of purchase price paid over the fair value of net assets acquired in a business combination accounted for as a purchase. As required by SFAS No. 142, "Goodwill and Other Intangibles" (SFAS 142), we no longer amortize goodwill but rather evaluate it for impairment on an annual basis, or more often, if events or circumstances change that could cause goodwill to become impaired. We have allocated our goodwill to reporting units for purposes of performing annual impairment tests. See Note 9 for a further discussion about goodwill.
We capitalize certain costs for software that is developed or obtained for internal use. Software costs are amortized on a straight-line basis over their estimated useful lives generally ranging from three to five years. Software assets are reviewed for impairment when events or circumstances indicate that the carrying value may not be recoverable over the remaining lives of the assets. Upgrades and enhancements are capitalized if they result in significant modifications that enable the software to perform tasks it was previously incapable of performing. Software maintenance, training, data
78
CUMMINS INC. AND SUBSIDIARIES
NOTES TO CONSOLIDATED FINANCIAL STATEMENTS (Continued)
NOTE 1. SUMMARY OF SIGNIFICANT ACCOUNTING POLICIES (Continued)
conversion and business process reengineering costs are expensed in the period in which they are incurred.
We charge the estimated costs of warranty programs, other than product recalls, to income at the time products are shipped to customers. We use historical experience of warranty programs to estimate the remaining liability for our various warranty programs. As a result of the uncertainty surrounding the nature and frequency of product recall programs, the liability for such programs is recorded when we commit to a recall action, which generally occurs when it is announced. We review and assess the liability for these programs on a quarterly basis. We also assess our ability to recover certain costs from our suppliers and record a receivable from the supplier when we believe a recovery is probable. At December 31, 2008, we had $16 million of receivables related to estimated supplier recoveries of which $8 million was included in "Trade and other receivables, net" and $8 million was included in "Other assets" on our Consolidated Balance Sheets. At December 31, 2007, we had $19 million of receivables related to estimated supplier recoveries of which $9 million was included in "Trade and other receivables, net" and $10 million was included in "Other assets" on our Consolidated Balance Sheets.
In addition, we sell extended warranty coverage on most of our engines. The revenue collected is initially deferred and is recognized as revenue in proportion to the costs expected to be incurred in performing services over the contract period. We compare the remaining deferred revenue balance quarterly to the estimated amount of future claims under extended warranty programs and provide an additional accrual when the deferred revenue balance is less than expected future costs.
Our shipping and handling costs are expensed as incurred. Those shipping and handling costs associated with operations of our inventory distribution centers and warehouse facilities were previously classified as "Selling, general and administrative expenses" in our Consolidated Statements of Income. In accordance with Emerging Issues Task Force (EITF) Issue No. 00-10 "Accounting for Shipping and Handling Fees and Costs," we previously disclosed the amount of these shipping and handling costs that were included as "Selling, general and administrative expenses" in the notes to our Consolidated Financial Statements. Beginning January 1, 2007, we revised our accounting policy and all shipping and handling costs are now classified as "Cost of sales." This presentation is more consistent with current industry practice. For purposes of comparability, the $130 million previously classified as "Selling, general and administrative expenses" for the year ended 2006 have been adjusted retrospectively to apply the new method. This change had no impact on operating income, net income or earnings per share.
Our research and development program is focused on product improvements, innovations and cost reductions for our customers. We expense research and development expenditures, net of contract reimbursements, when incurred. The major components of research and development expenses are salaries, fringes and consulting fees. Research and development expenses, net of contract reimbursements, were $422 million in 2008, $318 million in 2007 and $312 million in 2006. Contract reimbursements were $61 million in 2008, $52 million in 2007 and $40 million in 2006.
79
CUMMINS INC. AND SUBSIDIARIES
NOTES TO CONSOLIDATED FINANCIAL STATEMENTS (Continued)
NOTE 1. SUMMARY OF SIGNIFICANT ACCOUNTING POLICIES (Continued)
In accordance with the provisions of various joint venture agreements, we may purchase products and components from the joint ventures, sell products and components to the joint ventures and the joint ventures may sell products and components to unrelated parties. Joint venture transfer prices to us may differ from normal selling prices. Certain joint venture agreements transfer product to us at cost, some transfer product to us on a cost-plus basis, and others transfer product to us at market value. Our related party sales are presented on the face of our Consolidated Statement of Income. Our related party purchases were not material to our financial position or results of operations.
RECENTLY ADOPTED AND RECENTY ISSUED ACCOUNTING PRONOUNCEMENTS
Accounting Pronouncements Recently Adopted
In July 2006, the Financial Accounting Standards Board (FASB) issued FASB Interpretation (FIN) No. 48, "Accounting for Uncertainty in Income Taxes—an interpretation of FASB Statement No. 109" (FIN 48), which prescribes a recognition threshold and measurement process for recording in the financial statements, uncertain tax positions taken or expected to be taken in a tax return. In addition, FIN 48 provides guidance on the derecognition, classification, accounting in interim periods and disclosure requirements for uncertain tax positions. The adoption of FIN 48, effective January 1, 2007, did not have a material effect on our Consolidated Financial Statements. See Note 4 to the Consolidated Financial Statements for further information regarding the adoption of this standard.
In September 2006, the FASB issued SFAS No. 157, "Fair Value Measurements" (SFAS 157), which defines fair value, establishes a framework for measuring fair value and expands disclosures about fair value measurements. The adoption of SFAS 157, effective January 1, 2008, did not have a material impact on our Consolidated Financial Statements. See Note 6 for further information regarding the adoption of this standard.
In September 2006, the FASB issued SFAS No. 158, "Employers' Accounting for Defined Benefit Pension and Other Postretirement Plans—an amendment of FASB Statements No. 87, 88, 106 and 132(R)" (SFAS 158). This statement requires balance sheet recognition of the overfunded or underfunded status of pension and postretirement benefit plans. In addition, the measurement date (the date at which plan assets and the benefit obligation are measured) is required to be the company's fiscal year end. During 2006, we adopted the provisions (except for the measurement date change) of SFAS 158, "Employers' Accounting for Defined Benefit Pension and Other Postretirement Plans—an amendment of FASB Statements No. 87, 88, 106 and 132(R)," which resulted in a $94 million non-cash charge to equity. We adopted the measurement date provisions of SFAS 158 effective January 1, 2008. The majority of our pension and postretirement plans previously used a November 30 measurement date. All plans are now measured at December 31, consistent with the company's fiscal year end. The non-cash effect of the adoption of the measurement date provisions of SFAS 158 decreased shareholders' equity by approximately $10 million ($7 million after-tax) and increased long-term liabilities by approximately $10 million. There was no effect on our results of operations. See Note 11 for further information regarding the adoption of this standard.
80
CUMMINS INC. AND SUBSIDIARIES
NOTES TO CONSOLIDATED FINANCIAL STATEMENTS (Continued)
NOTE 1. SUMMARY OF SIGNIFICANT ACCOUNTING POLICIES (Continued)
Accounting Pronouncements Issued But Not Yet Effective
In December 2007, the FASB issued SFAS No. 141 (revised 2007), "Business Combinations" (SFAS 141R), which is effective for fiscal years beginning after December 15, 2008. SFAS 141R makes significant changes to both the accounting and disclosures related to the acquisition of a business and could materially impact how we account for future business combination transactions. Because the standard will only impact transactions entered into after January 1, 2009, SFAS 141R will not impact our Consolidated Financial Statements upon adoption.
In December 2007, the FASB issued SFAS No. 160, "Noncontrolling Interests in Consolidated Financial Statements" (SFAS 160), which is effective for fiscal years beginning after December 15, 2008. SFAS 160 amends Accounting Research Bulletin No. 51, "Consolidated Financial Statements" (ARB 51) and establishes accounting and reporting standards for the noncontrolling interest in a subsidiary and for the deconsolidation of a subsidiary. For Cummins, the most significant impact of the standard, at adoption, will be to reclass a majority of our minority interests ($250 million at December 31, 2008) to be included as a part of equity, which may affect certain performance and equity ratios. We are currently evaluating the potential additional impact that SFAS 160 may have on our Consolidated Financial Statements.
In March 2008, the FASB issued SFAS No. 161, "Disclosures about Derivative Instruments and Hedging Activities" (SFAS 161), which is effective for fiscal years beginning after November 15, 2008. SFAS 161 amends SFAS No. 133, "Accounting for Derivative Instruments and Hedging Activities" (SFAS 133) and requires enhanced disclosures about a company's derivative and hedging activities. We do not expect the adoption of SFAS 161 to have a material impact on our Consolidated Financial Statements, but are still evaluating the additional disclosure requirements.
NOTE 2. INVESTMENTS IN EQUITY INVESTEES
Investments in and advances to equity investees and our ownership percentage is as follows:
| |
|
December 31, | |||||||
|---|---|---|---|---|---|---|---|---|---|
| |
Ownership % | 2008 | 2007 | ||||||
| |
|
in millions |
|||||||
North American distributors |
30%-50% | $ | 113 | $ | 80 | ||||
Dongfeng Cummins Engine Co. Ltd. |
50% | 106 | 121 | ||||||
Chongqing Cummins Engine Company Limited |
50% | 57 | 33 | ||||||
Beijing Foton Cummins Engine Company Limited |
50% | 56 | 35 | ||||||
Cummins-Scania XPI Manufacturing, LLC |
50% | 55 | 22 | ||||||
Komatsu alliances |
20%-50% | 41 | 27 | ||||||
Tata Cummins Ltd. |
50% | 35 | 43 | ||||||
Shanghai Fleetguard Filter Co., Ltd. |
50% | 18 | 15 | ||||||
European Engine Alliance |
33% | — | 62 | ||||||
Other |
Various | 107 | 76 | ||||||
Total |
$ | 588 | $ | 514 | |||||
81
CUMMINS INC. AND SUBSIDIARIES
NOTES TO CONSOLIDATED FINANCIAL STATEMENTS (Continued)
NOTE 2. INVESTMENTS IN EQUITY INVESTEES (Continued)
Equity, royalty and interest income from investees, net of applicable taxes, was as follows:
| |
For the years ended December 31, | |||||||||
|---|---|---|---|---|---|---|---|---|---|---|
| |
2008 | 2007 | 2006 | |||||||
| |
in millions |
|||||||||
Distribution Entities |
||||||||||
North American distributors |
$ | 100 | $ | 83 | $ | 48 | ||||
All other distributors |
12 | 8 | 6 | |||||||
Manufacturing Entities |
||||||||||
Dongfeng Cummins Engine Company, Ltd |
$ | 55 | $ | 41 | $ | 19 | ||||
Chongqing Cummins Engine Company, Ltd |
30 | 22 | 15 | |||||||
Shanghai Fleetguard Filter Co. Ltd. |
8 | 6 | 5 | |||||||
Tata Cummins Ltd. |
7 | 13 | 11 | |||||||
Cummins MerCruiser Diesel Marine LLC. |
3 | 11 | 6 | |||||||
All other manufacturers |
16 | 8 | 9 | |||||||
Cummins share of net income |
231 | 192 | 119 | |||||||
Royalty and interest income |
22 | 13 | 21 | |||||||
Equity, royalty and interest income from investees |
$ | 253 | $ | 205 | $ | 140 | ||||
We have an extensive worldwide distributor and dealer network through which we sell and distribute our products and services. Generally, our distributors are divided by geographic region with some of our distributors being wholly-owned by Cummins, some partially-owned and the majority are independently owned. We consolidate all wholly-owned distributors and partially-owned distributors where we are the primary beneficiary and account for other partially-owned distributors using the equity method of accounting (see Note 1).
Our distribution channel in North America includes 13 partially-owned entities. Our equity interests in these nonconsolidated entities range from 30 percent to 50 percent. While each distributor is a separate legal entity, the business of each is the same as that of our wholly owned distributors based in other parts of the world. All of our distributors, irrespective of the legal structure, offer the full range of our products and services to customers and end-users in their respective markets.
We also have an equity interest in four international distributors with interests ranging from 20 percent to 50 percent.
We are contractually obligated to repurchase new engines, parts and components, special tools and signage from our North American distributors following an ownership transfer or termination of the distributor. In addition, in certain cases where we own a partial interest in a distributor, we are obligated to purchase the other equity holders' interests if certain events occur (such as the death of the distributor principal or a change in control of Cummins Inc.). The purchase price of the equity interests is determined based on the fair value of the distributor's assets. Outside of North America, repurchase obligations and practices vary by region. All distributors that are partially-owned are considered to be related parties in our Consolidated Financial Statements.
82
CUMMINS INC. AND SUBSIDIARIES
NOTES TO CONSOLIDATED FINANCIAL STATEMENTS (Continued)
NOTE 2. INVESTMENTS IN EQUITY INVESTEES (Continued)
Manufacturing ventures are formed with customers and allow us to increase market penetration in geographic regions, reduce capital spending, streamline our supply chain management and develop technologies. Our largest manufacturing ventures are based in China and are included in the list below. Our engine manufacturing joint ventures are supplied by our Components segment in the same manner as they supply our wholly owned engine and power generation manufacturing facilities. Component segment joint ventures provide fuel system, filtration and turbocharger products that are used in our engines as well as some competitors' products.
Cummins/Dongfeng Joint Ventures
Dongfeng Cummins Engine Company, Ltd. (DCEC) is a joint venture with Dongfeng Automotive Corporation, a subsidiary of Dongfeng Motor Company (Dongfeng), one of the largest medium-duty truck manufacturers in China. DCEC produces Cummins B, C and L Series four-to nine-liter mechanical engines, full-electronic diesel engines, with a power range from 100 to 370 horsepower, and natural gas engines.
Shanghai Fleetguard Filter Co., Ltd. is a joint venture with Dongfeng that manufactures filtration and exhaust systems.
The East Asia Technical center is a joint venture with DCEC that provides engineering and technical development services for the full range of Cummins products built in China. A series of projects are underway in the technical center, including the development of a new 13-liter engine platform for the heavy-duty truck market served by DCEC. The results of the East Asia Technical center are included in our Consolidated Financial Statements.
Chongqing Cummins Engine Company, Ltd.
Chongqing Cummins Engine Company, Ltd. is a joint venture with Chongqing Heavy Duty Vehicle Group that manufactures several models of our heavy-duty and high-horsepower diesel engines, primarily serving the industrial and stationary power markets in China.
Tata Group Joint Venture
Tata Cummins Limited is a joint venture with Tata Motors Ltd., the largest automotive company in India and a member of the Tata group of companies. This joint venture manufactures the Cummins B Series engine in India for use in trucks manufactured by Tata Motors, as well as for various of our industrial and power generation applications.
Cummins MerCruiser Diesel Marine LLC
Cummins MerCruiser Diesel Marine LLC is a joint venture with Mercury Marine, a division of Brunswick Corporation, to develop, manufacture and sell recreational marine diesel products, including engines, sterndrive packages, inboard packages, instrument and controls, service systems and replacement and service parts and assemblies, complete integration systems and other related products.
83
CUMMINS INC. AND SUBSIDIARIES
NOTES TO CONSOLIDATED FINANCIAL STATEMENTS (Continued)
NOTE 2. INVESTMENTS IN EQUITY INVESTEES (Continued)
We have approximately $279 million in our investment account at December 31, 2008, that represents cumulative undistributed income in our equity investees. Summary financial information for our equity investees is as follows:
| |
As of and for the years ended December 31, | |||||||||
|---|---|---|---|---|---|---|---|---|---|---|
| |
2008 | 2007 | 2006 | |||||||
| |
in millions |
|||||||||
Net sales |
$ | 6,610 | $ | 5,716 | $ | 4,224 | ||||
Gross margin |
1,509 | 1,320 | 954 | |||||||
Net income |
498 | 451 | 296 | |||||||
Cummins share of net income |
$ | 231 | $ | 192 | $ | 119 | ||||
Royalty and interest income |
22 | 13 | 21 | |||||||
Total equity, royalty and interest income from investees |
$ | 253 | $ | 205 | $ | 140 | ||||
Current assets |
$ | 2,189 | $ | 2,279 | ||||||
Noncurrent assets |
903 | 1,071 | ||||||||
Current liabilities |
(1,440 | ) | (1,726 | ) | ||||||
Noncurrent liabilities |
(358 | ) | (442 | ) | ||||||
Net assets |
$ | 1,294 | $ | 1,182 | ||||||
Cummins share of net assets |
$ | 599 | $ | 512 | ||||||
We have executed restructuring actions primarily in the form of voluntary and involuntary separation programs in the fourth quarter of 2008. These actions were in response to the continued deterioration we saw in our U.S. businesses and most key markets around the world in the second half of 2008, as well as a reduction in orders in most U.S. and global markets for 2009. We reduced our worldwide professional workforce by approximately 650 employees, or 4.5 percent. We offered a voluntary retirement package to certain active professional employees in the U.S. based on a clearly defined set of criteria. We also took voluntary and involuntary actions which included approximately 800 hourly employees the majority of which received severance benefits. The compensation packages contained salary and continuation of benefits, including health care, life insurance and outplacement services. The voluntary retirement package was accepted by approximately 150 employees. The remaining professional reductions of 500 employees were involuntary. The expenses recorded during the year ended December 31, 2008, included severance costs related to both voluntary and involuntary terminations. During 2008, we incurred a pretax charge related to the professional and hourly restructuring initiatives of approximately $37 million.
Employee termination and severance costs were recorded based on approved plans developed by the businesses and corporate management which specified positions to be eliminated, benefits to be paid under existing severance plans or statutory requirements and the expected timetable for completion of the plan. Estimates of restructuring were made based on information available at the time charges were recorded. Due to the inherent uncertainty involved, actual amounts paid for such activities may differ from amounts initially recorded and we may need to revise previous estimates.
84
CUMMINS INC. AND SUBSIDIARIES
NOTES TO CONSOLIDATED FINANCIAL STATEMENTS (Continued)
NOTE 3. RESTRUCTURING CHARGES (Continued)
At December 31, 2008, of the approximately 1,450 employees to be affected by this plan, 1,250 had been terminated.
The table below summarizes the balance of accrued restructuring expenses, which is included in the balance of Other accrued expenses in the consolidated balance sheets for the year ended December 31, 2008:
| |
Total Expenses | Payments | Accrued Balance at December 31, 2008 |
|||||||
|---|---|---|---|---|---|---|---|---|---|---|
| |
in millions |
|||||||||
Restructuring charges(1) |
$ | 37 | $ | 3 | $ | 34 | ||||
We do not include restructuring charges in the segment results. The pretax impact of allocating restructuring charges for the year ended December 31, 2008, would have been as follows:
| |
in millions | |||
|---|---|---|---|---|
Engine |
$ | 15 | ||
Power Generation |
3 | |||
Components |
14 | |||
Distribution |
2 | |||
Corporate |
3 | |||
Total restructuring charges |
$ | 37 | ||
The provision (benefit) for income taxes consists of the following:
| |
Years ended December 31, | |||||||||||
|---|---|---|---|---|---|---|---|---|---|---|---|---|
| |
2008 | 2007 | 2006 | |||||||||
| |
in millions |
|||||||||||
Current: |
||||||||||||
U.S. federal and state |
$ | 16 | $ | 137 | $ | 73 | ||||||
Foreign |
345 | 184 | 112 | |||||||||
Total current |
361 | 321 | 185 | |||||||||
Deferred: |
||||||||||||
U.S. federal and state |
(26 | ) | 1 | 128 | ||||||||
Foreign |
25 | 59 | 11 | |||||||||
Total deferred |
(1 | ) | 60 | 139 | ||||||||
Income tax expense |
$ | 360 | $ | 381 | $ | 324 | ||||||
85
CUMMINS INC. AND SUBSIDIARIES
NOTES TO CONSOLIDATED FINANCIAL STATEMENTS (Continued)
NOTE 4. INCOME TAXES (Continued)
A reconciliation of the income tax provision at the U.S. federal income tax rate of 35 percent to the actual effective tax rate is as follows:
| |
Years ended December 31, | ||||||||||
|---|---|---|---|---|---|---|---|---|---|---|---|
| |
2008 | 2007 | 2006 | ||||||||
| |
in millions |
||||||||||
Income (loss) before income taxes and minority interests: |
|||||||||||
U.S. income |
$ | (25 | ) | $ | 391 | $ | 597 | ||||
Foreign income |
1,203 | 778 | 486 | ||||||||
|
$ | 1,178 | $ | 1,169 | $ | 1,083 | |||||
U.S. federal statutory rate |
35.0 |
% |
35.0 |
% |
35.0 |
% |
|||||
State income tax, net of federal effect |
— | 1.4 | 3.1 | ||||||||
Research tax credits |
(0.8 | ) | (1.3 | ) | (1.4 | ) | |||||
Export tax benefits |
— | — | (1.4 | ) | |||||||
Differences in rates and taxability of foreign subsidiaries and joint ventures |
(4.3 | ) | (2.4 | ) | (2.4 | ) | |||||
Settlement of tax audits |
(0.1 | ) | — | (2.6 | ) | ||||||
All other, net |
0.8 | (0.1 | ) | (0.4 | ) | ||||||
Effective tax rate |
30.6 | % | 32.6 | % | 29.9 | % | |||||
Except for the U.K. group, we provide for the additional taxes that would be due upon the dividend distribution of the income of our foreign subsidiaries and joint ventures assuming the full utilization of foreign tax credits. The unremitted income of the U.K. group is considered to be permanently reinvested and the determination of the deferred tax liability, if any, that might be due should that income be distributed is not practicable. Income before income taxes include equity income of foreign joint ventures of $140 million, $118 million and $78 million for the years ended December 31, 2008, 2007, and 2006, respectively. This equity income is recorded net of foreign taxes. Additional U.S. income taxes of $30 million, $18 million and $13 million for the years ended December 31, 2008, 2007 and 2006, respectively, were provided for the additional U.S. taxes that will ultimately be due upon the distribution of the foreign joint venture equity income.
The American Jobs Creation Act of 2004 repealed the U.S. export tax benefits beginning in 2007 and phased the benefits down to 80 percent of their value in 2005 and 60 percent in 2006. The export benefits are partially replaced with a new U.S. manufacturer's tax deduction which phases in one-third in 2005-2006, two-thirds in 2007-2009 and 100 percent after 2009. The U.S. manufacturer's tax benefits were $1 million, $2 million and $3 million for the years ended December 31, 2008, 2007, and 2006, respectively.
Our 2008 income tax provision includes a $10 million (0.8 percent) reduction in the fourth quarter due to the legislative reinstatement of the U.S. research tax credit.
Our 2006 income tax provision includes a $28 million (2.6 percent) reduction in the second quarter due to the favorable resolution of tax uncertainties related to prior years, and a $12 million (1.1 percent) increase in the first quarter for the effect of new Indiana tax legislation.
86
CUMMINS INC. AND SUBSIDIARIES
NOTES TO CONSOLIDATED FINANCIAL STATEMENTS (Continued)
NOTE 4. INCOME TAXES (Continued)
Carryforward tax benefits and the tax effect of temporary differences between financial and tax reporting that give rise to net deferred tax assets are as follows:
| |
December 31, | |||||||
|---|---|---|---|---|---|---|---|---|
| |
2008 | 2007 | ||||||
| |
in millions |
|||||||
Deferred tax assets: |
||||||||
U.S. state carryforward benefits |
$ | 27 | $ | 23 | ||||
Foreign carryforward benefits |
13 | 16 | ||||||
Employee benefit plans |
474 | 257 | ||||||
Warranty and marketing expenses |
341 | 247 | ||||||
Deferred research and development expenses |
68 | 97 | ||||||
Other |
163 | 71 | ||||||
Gross deferred tax assets |
1,086 | 711 | ||||||
Valuation allowance |
(25 | ) | (24 | ) | ||||
Total deferred tax assets |
1,061 | 687 | ||||||
Deferred tax liabilities: |
||||||||
Property, plant and equipment |
(98 | ) | (59 | ) | ||||
Unremitted income of foreign subsidiaries and joint ventures |
(94 | ) | (77 | ) | ||||
Other |
(34 | ) | (8 | ) | ||||
Total deferred tax liabilities |
(226 | ) | (144 | ) | ||||
Net deferred tax assets |
$ | 835 | $ | 543 | ||||
A valuation allowance is recorded to reduce the gross deferred tax assets to an amount we believe is more likely than not to be realized. The valuation allowance increased in 2008 by a net $1 million and decreased in 2007 by a net $2 million. The valuation allowance is primarily attributable to the uncertainty regarding the realization of a portion of the U.S. state and foreign net operating loss and tax credit carryforward benefits.
The deferred income tax and current income taxes payable balances are classified in the Consolidated Balance Sheets as follows:
| |
December 31, | ||||||
|---|---|---|---|---|---|---|---|
| |
2008 | 2007 | |||||
| |
in millions |
||||||
Current assets |
$ | 347 | $ | 276 | |||
Long-term assets |
491 | 271 | |||||
Other liabilities and deferred revenue |
(3 | ) | (4 | ) | |||
|
$ | 835 | $ | 543 | |||
Other accrued expenses |
$ | 138 | $ | 41 | |||
On January 1, 2007, we adopted FASB Interpretation (FIN) No. 48, "Accounting for Uncertainty in Income Taxes—an interpretation of FASB Statement No. 109." FIN 48 prescribes a recognition threshold that a tax position is required to meet before being recognized in the financial statements
87
CUMMINS INC. AND SUBSIDIARIES
NOTES TO CONSOLIDATED FINANCIAL STATEMENTS (Continued)
NOTE 4. INCOME TAXES (Continued)
and provides guidance on derecognition, measurement, classification, interest and penalties, accounting in interim periods, disclosure and transition rules. The adoption of FIN 48 resulted in an increase to our beginning balance of retained earnings of $0.8 million and did not have any impact on our results of operations. As of the adoption date, we had gross unrecognized tax benefits of $49 million. Of this total, $37 million, if recognized, would favorably affect the effective tax rate in future periods. A reconciliation of the beginning and ending amount of unrecognized tax benefits is as follows:
| |
in millions | |||
|---|---|---|---|---|
Balance at January 1, 2007 |
$ | 49 | ||
Additions based on tax positions related to the current year |
4 | |||
Reductions for tax positions of prior years |
(4 | ) | ||
Balance at December 31, 2007 |
$ | 49 | ||
Additions based on tax positions related to the current year |
5 | |||
Additions based on tax positions related to the prior years |
5 | |||
Reductions for tax positions relating to settlements with taxing authorities |
(2 | ) | ||
Balance at December 31, 2008 |
$ | 57 | ||
Included in the December 31, 2008 and 2007 balances are $35 million related to tax positions that, if recognized, would favorably affect the effective tax rate in future periods. Also, we had accrued interest expense related to the unrecognized tax benefits of $14 million and $11 million as of December 31, 2008 and 2007, respectively. We recognize potential accrued interest and penalties related to unrecognized tax benefits in income tax expense. During the years ending December 31, 2008 and 2007, we recognized approximately $2 million in interest expense in each period.
As a result of our global operations, we file income tax returns in various jurisdictions including U.S. federal, U.S. state, and foreign jurisdictions. We are routinely subject to examination by taxing authorities throughout the world, including Australia, Belgium, Brazil, Canada, China, France, India, Mexico, the United Kingdom (U.K.) and the U.S. Our U.S. federal income tax returns have been examined through 2004. With few exceptions, major U.S. state and foreign jurisdictions are no longer subject to income tax examinations for years before 2003. Various U.S. state and foreign tax audits are currently underway; however, we do not expect any significant change to our unrecognized tax benefits within the next year.
88
CUMMINS INC. AND SUBSIDIARIES
NOTES TO CONSOLIDATED FINANCIAL STATEMENTS (Continued)
A summary of marketable securities, all of which are classified as current, is as follows:
| |
December 31, | |||||||||||||||||||
|---|---|---|---|---|---|---|---|---|---|---|---|---|---|---|---|---|---|---|---|---|
| |
2008 | 2007 | ||||||||||||||||||
| |
Cost | Gross unrealized gains/ (losses) |
Estimated fair value |
Cost | Gross unrealized gains/ (losses) |
Estimated fair value |
||||||||||||||
| |
in millions |
|||||||||||||||||||
Available-for-sale: |
||||||||||||||||||||
Debt mutual funds |
$ | 63 | $ | — | $ | 63 | $ | 94 | $ | — | $ | 94 | ||||||||
Government debt securities—non-U.S. |
5 | — | 5 | 6 | (1 | ) | 5 | |||||||||||||
Corporate debt securities |
6 | — | 6 | 12 | — | 12 | ||||||||||||||
Equity securities and other |
— | 3 | 3 | — | 9 | 9 | ||||||||||||||
Total marketable securities |
$ | 74 | $ | 3 | $ | 77 | $ | 112 | $ | 8 | $ | 120 | ||||||||
Proceeds from sales and maturities of marketable securities were $409 million, $395 million and $273 million in 2008, 2007 and 2006, respectively. Gross realized gains from the sale of available-for-sale securities were $1 million for each of the years ended 2008, 2007 and 2006. Gross realized losses from the sale of available-for-sale securities were less than $1 million in 2008, 2007 and 2006.
At December 31, 2008, the fair value of available-for-sale investments in debt securities by contractual maturity is as follows:
Maturity date
|
Fair value | ||||
|---|---|---|---|---|---|
| |
in millions |
||||
1 year or less |
$ | 4 | |||
1-5 years |
2 | ||||
5-10 years |
3 | ||||
After 10 years |
2 | ||||
Total |
$ | 11 | |||
NOTE 6. FAIR VALUE OF FINANCIAL INSTRUMENTS
In September 2006, the FASB issued SFAS 157, which defines fair value, establishes a market-based framework for measuring fair value and expands disclosures about fair value measurements. SFAS 157 is applicable whenever another accounting pronouncement requires or permits assets and liabilities to be measured at fair value. SFAS 157 does not expand or require any new fair value measures. SFAS 157 is effective for financial assets and financial liabilities for fiscal years beginning after November 15, 2007. FASB Staff Position (FSP) 157-2 "Partial Deferral of the Effective Date of Statement No. 157" (FSP 157-2), deferred the effective date of SFAS 157 for most non-financial assets and non-financial liabilities to fiscal years beginning after November 15, 2008. We adopted this statement prospectively for our fiscal year beginning January 1, 2008, except for non-financial assets and non-financial liabilities as deferred until January 1, 2009, by FSP 157-2. SFAS 157 does not require
89
CUMMINS INC. AND SUBSIDIARIES
NOTES TO CONSOLIDATED FINANCIAL STATEMENTS (Continued)
NOTE 6. FAIR VALUE OF FINANCIAL INSTRUMENTS (Continued)
retroactive restatement of prior periods. The adoption of SFAS 157 did not materially impact our Consolidated Financial Statements.
As defined in SFAS 157, fair value is the price that would be received to sell an asset or paid to transfer a liability in an orderly transaction between market participants at the measurement date (exit price). We utilize market data or assumptions that market participants would use in pricing the asset or liability, including assumptions about risk and the risks inherent in the inputs to the valuation technique. These inputs can be readily observable, market corroborated, or generally unobservable. We primarily apply the market approach for recurring fair value measurements and utilize the best available information. Accordingly, we utilize valuation techniques that maximize the use of observable inputs and minimize the use of unobservable inputs. The company is able to classify fair value balances based on the observability of those inputs. SFAS 157 establishes a fair value hierarchy that prioritizes the inputs used to measure fair value. The hierarchy gives the highest priority to unadjusted quoted prices in active markets for identical assets or liabilities (level 1 measurement) and the lowest priority to unobservable inputs (level 3 measurement). The three levels of the fair value hierarchy defined by SFAS 157 are as follows:
Level 1—Quoted prices are available in active markets for identical assets or liabilities as of the reporting date. Active markets are those in which transactions for the asset or liability occur in sufficient frequency and volume to provide pricing information on an ongoing basis. Level 1 primarily consists of financial instruments such as listed equities and publicly traded bonds.
Level 2—Pricing inputs are other than quoted prices in active markets included in level 1, which are either directly or indirectly observable as of the reported date. Level 2 includes those financial instruments that are valued using models or other valuation methodologies. These models are primarily industry-standard models that consider various assumptions, including quoted forward prices for commodities, time value, volatility factors, and current market and contractual prices for the underlying instruments, as well as other relevant economic measures. Substantially all of these assumptions are observable in the marketplace throughout the full term of the instrument, can be derived from observable data or are supported by observable levels at which transactions are executed in the marketplace. Instruments in this category include non-exchange-traded derivatives such as over-the-counter forwards and options.
Level 3—Pricing inputs include significant inputs that are generally less observable from objective sources. These inputs may be used with internally developed methodologies that result in management's best estimate of fair value. At each balance sheet date, the company performs an analysis of all instruments subject to SFAS 157 and includes, in level 3, all of those whose fair value is based on significant unobservable inputs. At December 31, 2008, we did not have any level 3 financial assets or liabilities.
The majority of the assets and liabilities we carry at fair value are available-for-sale (AFS) securities and derivatives. AFS securities are derived from level 1 or level 2 inputs. The predominance of market inputs are actively quoted and can be validated through external sources, including brokers, market transactions and third-party pricing services.
The fair value measurement of derivatives results primarily from level 2 inputs. Many of our derivative contracts are valued utilizing publicly available pricing data of contracts with similar terms. In other cases, the contracts are valued using current spot market data adjusted for the appropriate
90
CUMMINS INC. AND SUBSIDIARIES
NOTES TO CONSOLIDATED FINANCIAL STATEMENTS (Continued)
NOTE 6. FAIR VALUE OF FINANCIAL INSTRUMENTS (Continued)
current forward curves provided by external financial institutions. We participate in commodity swap contracts, currency forward contracts, and interest rate swaps. When material, we adjust the values of our derivative contracts for counter-party or our credit risk.
The following table summarizes our financial instruments recorded at fair value in our Consolidated Balance Sheets at December 31, 2008:
| |
Fair Value Measurements Using | ||||||||||||
|---|---|---|---|---|---|---|---|---|---|---|---|---|---|
| |
Quoted prices in active markets for identical assets (Level 1) |
Significant other observable inputs (Level 2) |
Significant unobservable inputs (Level 3) |
Total | |||||||||
| |
in millions |
||||||||||||
Available-for-sale securities |
$ | 59 | $ | 18 | $ | — | $ | 77 | |||||
Derivative assets |
— | 80 | — | 80 | |||||||||
Derivative liabilities |
— | (81 | ) | — | (81 | ) | |||||||
Total |
$ | 59 | $ | 17 | $ | — | $ | 76 | |||||
Fair Value of Other Financial Instruments
Based on borrowing rates currently available to us for bank loans with similar terms and average maturities, considering our risk premium, the fair value of total debt, including current maturities, at December 31, 2008, was approximately $567 million. The carrying value at that date was $698 million. At December 31, 2007, the fair and carrying values of total debt, including current maturities, were $670 million and $674 million, respectively. The carrying values of all other receivables and liabilities approximated fair values.
Inventories include the following:
| |
December 31, | ||||||
|---|---|---|---|---|---|---|---|
| |
2008 | 2007 | |||||
| |
in millions |
||||||
Finished products |
$ | 860 | $ | 770 | |||
Work-in-process and raw materials |
1,021 | 1,007 | |||||
Inventories at FIFO cost |
1,881 | 1,777 | |||||
Excess of FIFO over LIFO |
(98 | ) | (85 | ) | |||
Total inventories |
$ | 1,783 | $ | 1,692 | |||
91
CUMMINS INC. AND SUBSIDIARIES
NOTES TO CONSOLIDATED FINANCIAL STATEMENTS (Continued)
NOTE 8. PROPERTY, PLANT AND EQUIPMENT
Details of our property, plant and equipment balance are as follows:
| |
December 31, | ||||||
|---|---|---|---|---|---|---|---|
| |
2008 | 2007 | |||||
| |
in millions |
||||||
Land and buildings |
$ | 799 | $ | 784 | |||
Machinery, equipment and fixtures |
3,265 | 3,247 | |||||
Construction in process |
475 | 282 | |||||
|
4,539 | 4,313 | |||||
Less accumulated depreciation |
(2,698 | ) | (2,668 | ) | |||
Property, plant and equipment, net |
$ | 1,841 | $ | 1,645 | |||
NOTE 9. GOODWILL AND OTHER INTANGIBLE ASSETS
The following table summarizes the changes in the carrying amount of goodwill for 2008 and 2007:
| |
Components | Power Generation |
Engine | Distribution | Total | ||||||||||||
|---|---|---|---|---|---|---|---|---|---|---|---|---|---|---|---|---|---|
| |
in millions |
||||||||||||||||
Goodwill at December 31, 2006 |
$ | 332 | $ | 12 | $ | 7 | $ | 5 | $ | 356 | |||||||
Additions |
11 | — | — | 2 | 13 | ||||||||||||
Dispositions |
(6 | ) | — | — | — | (6 | ) | ||||||||||
Translation and other |
2 | 1 | (1 | ) | — | 2 | |||||||||||
Goodwill at December 31, 2007 |
339 | 13 | 6 | 7 | 365 | ||||||||||||
Additions |
— | — | — | — | — | ||||||||||||
Dispositions |
— | — | — | — | — | ||||||||||||
Translation and other |
(3 | ) | — | — | — | (3 | ) | ||||||||||
Goodwill at December 31, 2008 |
$ | 336 | $ | 13 | $ | 6 | $ | 7 | $ | 362 | |||||||
We have elected to perform the annual impairment test of our recorded goodwill as required by SFAS 142 as of the end of our third quarter. The results of this annual impairment test indicated that the fair value of each of our reporting units as of September 28, 2008 and September 30, 2007, exceeded their carrying, or book value, including goodwill, and therefore our recorded goodwill was not subject to impairment. The fair value was determined utilizing the expected present value of future cash flows.
92
CUMMINS INC. AND SUBSIDIARIES
NOTES TO CONSOLIDATED FINANCIAL STATEMENTS (Continued)
NOTE 9. GOODWILL AND OTHER INTANGIBLE ASSETS (Continued)
Intangible assets that have finite useful lives are amortized over their estimated useful lives. The following table summarizes our other intangible assets with finite useful lives that are subject to amortization:
| |
December 31, | |||||||
|---|---|---|---|---|---|---|---|---|
| |
2008 | 2007 | ||||||
| |
in millions |
|||||||
Software |
$ | 343 | $ | 276 | ||||
Accumulated amortization |
(138 | ) | (114 | ) | ||||
Net software |
205 | 162 | ||||||
Trademarks, patents and other |
34 | 15 | ||||||
Accumulated amortization |
(16 | ) | (4 | ) | ||||
Net trademarks, patents and other |
18 | 11 | ||||||
Total |
$ | 223 | $ | 173 | ||||
Amortization expense for software and other intangibles totaled $50 million, $31 million and $27 million for the years ended December 31, 2008, 2007 and 2006, respectively. Internal and external software costs (excluding those related to research, re-engineering and training) and trademarks and patents are amortized generally over a three to five-year period. The projected amortization expense of our intangible assets, assuming no further acquisitions or dispositions, is approximately $61 million in 2009, $54 million in 2010, $46 million in 2011, $36 million in 2012 and $20 million in 2013.
| |
December 31, | ||||||
|---|---|---|---|---|---|---|---|
| |
2008 | 2007 | |||||
| |
in millions |
||||||
Current portion of long-term debt and loans payable: |
|||||||
Loans payable |
$ | 39 | $ | 13 | |||
Current maturities of long-term debt |
30 | 106 | |||||
Current portion of long-term debt and loans payable |
$ | 69 | $ | 119 | |||
Loans payable consist primarily of notes payable to financial institutions. The weighted-average interest rate for notes payable, bank overdrafts and current maturities of long-term debt at December 31, 2008, 2007 and 2006, was 7.03 percent, 7.43 percent, and 7.13 percent, respectively.
On June 30, 2008, we entered into a Three-Year Revolving Credit Agreement, (the "Credit Agreement"), with a syndicate of lenders and issuers named therein. The Credit Agreement provides a $1.1 billion senior unsecured revolving credit facility (the "Credit Facility"), the proceeds of which are to be used to provide for working capital or for other general corporate purposes of Cummins.
The Credit Facility matures on June 30, 2011. The Credit Facility is unsecured and amounts payable under it will rank pro rata with all other unsecured, unsubordinated indebtedness of Cummins. A portion of the Credit Facility, up to $100 million, is available for swingline loans denominated in U.S. dollars. Loans will bear interest at (i) a base rate or (ii) a rate equal to LIBOR plus an applicable
93
CUMMINS INC. AND SUBSIDIARIES
NOTES TO CONSOLIDATED FINANCIAL STATEMENTS (Continued)
NOTE 10. DEBT (Continued)
margin based on the credit ratings of Cummins outstanding senior unsecured long-term debt. Based on our current long-term debt ratings, the applicable margin on LIBOR loans was 2.0 percent per annum as of December 31, 2008. Loans may be prepaid without premium or penalty, subject to customary breakage costs.
The Credit Facility replaces $650 million in aggregate principal amount of a revolving credit facility (Former Credit Agreement) maintained by Cummins which was terminated effective June 30, 2008.
The Credit Agreement includes covenants substantially similar to those in the Former Credit Agreement, including, among others, (a) a leverage ratio, (b) fixed charge coverage ratio, (c) limitations on priority indebtedness, (d) limitations on our ability to consummate a merger, consolidation or sale of all or substantially all of our assets and (e) limitations on our ability to change the nature of our business.
The obligation of Cummins to pay amounts outstanding under the Credit Facility may be accelerated upon the occurrence of an "Event of Default" as defined in the Credit Agreement. Such Events of Default include, among others, (a) Cummins failure to pay the principal of, or interest on, borrowings under the Credit Facility, (b) any representation or warranty of Cummins in the Credit Agreement proving to be materially false or misleading, (c) Cummins breach of any of its covenants contained in the Credit Agreement and (d) the bankruptcy or insolvency of Cummins.
As of December 31, 2008, we had $1.06 billion available for borrowings under our $1.1 billion revolving credit facility and $194 million available for borrowings under our international short-term credit facilities. As of December 31, 2008 and 2007 we had $39 million and $35 million, respectively, in letters of credit outstanding against our revolving credit facility, however, there were no outstanding borrowings under this facility at December 31, 2008. Commitments outstanding under our international and other domestic facilities as of December 31, 2008 and 2007, were $39 million and $38 million,
94
CUMMINS INC. AND SUBSIDIARIES
NOTES TO CONSOLIDATED FINANCIAL STATEMENTS (Continued)
NOTE 10. DEBT (Continued)
respectively. Commitments outstanding related to performance bonds and other performance-related guarantees were $32 million and $50 million as of December 31, 2008 and 2007, respectively.
| |
December 31, | |||||||
|---|---|---|---|---|---|---|---|---|
| |
2008 | 2007 | ||||||
| |
in millions |
|||||||
Long-term debt: |
||||||||
Notes, 8.68%, due 2008 |
$ | — | $ | 49 | ||||
Term loan, 6.92%, due 2008 |
— | 25 | ||||||
Debentures, 6.75%, due 2027 |
58 | 58 | ||||||
Fair value adjustment due to hedge on indebtedness |
79 | — | ||||||
Debentures, 7.125%, due 2028 |
250 | 250 | ||||||
Debentures, 5.65%, due 2098 (effective interest rate 7.48%) |
165 | 165 | ||||||
Other |
44 | 13 | ||||||
|
596 | 560 | ||||||
Unamortized discount |
(37 | ) | (37 | ) | ||||
Capital leases |
100 | 138 | ||||||
Total long-term debt |
659 | 661 | ||||||
Less current maturities of long-term debt |
(30 | ) | (106 | ) | ||||
Long-term debt |
$ | 629 | $ | 555 | ||||
Principal payments required on long-term debt during the next five years are $30 million in 2009, $32 million in 2010, $26 million in 2011, $24 million in 2012 and $12 million in 2013.
The 8.68% notes related to a consolidated VIE (a grantor trust wholly-owned by a financial institution). Principal payments were made annually with the final payment paid in April 2008. The consolidation of the VIE is discussed in Note 22. Principal and interest payments due on the notes coincide with the payments that are due to the grantor trust under our lease of manufacturing equipment from the grantor trust. Our lease is described in Note 19. The notes were secured by the assets of the grantor trust which included only the manufacturing equipment and the trust's rights under the lease agreement with us.
Our total debt as of December 31, 2007, included $25 million (none of which is included in "Loans payable" in above table) related to a term loan at CDC with a financial institution. The loan was due in annual installments, with a final payment paid in 2008. Interest was payable semi-annually at a rate of 6.92%. The note was collateralized by substantially all of CDC's inventory and fixed assets with a book value of $49 million and $135 million, respectively, as of December 31, 2007.
Interest on the 6.75% debentures is payable on February 15 and August 15 each year. Holders of the debentures could elect to be repaid on February 15, 2007, at par value together with accrued interest to February 15, 2007. Such election, was irrevocable and was required to be made between December 15, 2006 and January 15, 2007. Approximately $62 million of the debentures were repaid on February 15, 2007, at the election of the holders. The debentures are also redeemable at our option after February 15, 2007, at a redemption price of par value plus accrued interest or an amount designed to ensure that the debenture holders are not penalized by the early redemption.
95
CUMMINS INC. AND SUBSIDIARIES
NOTES TO CONSOLIDATED FINANCIAL STATEMENTS (Continued)
NOTE 10. DEBT (Continued)
Interest on the $250 million 7.125% debentures and $165 million 5.65% debentures is payable on March 1 and September 1 of each year. The debentures are unsecured and are not subject to any sinking fund requirements. We can redeem the 7.125% debentures and the 5.65% debentures at any time prior to maturity at the greater of par plus accrued interest or an amount designed to ensure that the debenture holders are not penalized by the early redemption.
Our debt agreements contain several restrictive covenants. The most restrictive of these covenants applies to our revolving credit facility which will, among other things, limit our ability to incur additional debt or issue preferred stock, enter into sale-leaseback transactions, pay dividends, sell or create liens on our assets, make investments and merge or consolidate with any other person. In addition, we are subject to various financial covenants including a maximum debt-to-EBITDA ratio and a minimum interest coverage ratio. As of December 31, 2008, we were in compliance with all of the covenants under our borrowing agreements.
NOTE 11. PENSION AND OTHER POSTRETIREMENT BENEFITS
We sponsor several contributory and noncontributory pension plans covering substantially all employees. Generally, hourly employee pension benefits are earned based on years of service and compensation during active employment while future benefits for salaried employees are determined using a cash balance formula. The level of benefits and terms of vesting, however, may vary among plans. Pension plan assets are administered by trustees and are principally invested in equity securities and fixed income securities. It is our policy to make contributions to our various qualified plans in accordance with statutory funding requirements and any additional contributions we determine are appropriate. We have adopted the measurement date provisions of SFAS 158 effective January 1, 2008. The majority of our pension plans previously used a November 30 measurement date. All plans are now measured at December 31, consistent with the company's fiscal year end. The non-cash effect of the adoption of the measurement date provisions of SFAS 158 decreased shareholders' equity by approximately $10 million ($7 million after-tax) and increased long-term liabilities by approximately $10 million. There was no effect on our results of operations.
Obligations, Assets and Funded Status
The following tables present the changes in the benefit obligations and the various plan assets, the funded status of the plans, and the amounts recognized in our Consolidated Balance Sheets for our
96
CUMMINS INC. AND SUBSIDIARIES
NOTES TO CONSOLIDATED FINANCIAL STATEMENTS (Continued)
NOTE 11. PENSION AND OTHER POSTRETIREMENT BENEFITS (Continued)
significant pension plans. Non-U.S. plans represent plans sponsored in the U.K. Benefit obligation balances presented below reflect the projected benefit obligation (PBO) for our pension plans.
| |
U.S. Plans | Non-U.S. Plans | |||||||||||
|---|---|---|---|---|---|---|---|---|---|---|---|---|---|
| |
2008 | 2007 | 2008 | 2007 | |||||||||
| |
in millions |
||||||||||||
Change in benefit obligations |
|||||||||||||
Benefit obligations at beginning of year |
$ | 1,959 | $ | 1,990 | $ | 1,155 | $ | 1,249 | |||||
Service cost |
52 | 45 | 28 | 33 | |||||||||
Interest cost |
124 | 107 | 70 | 63 | |||||||||
Plan participants' contributions |
— | — | 1 | 2 | |||||||||
Amendments |
— | 1 | — | — | |||||||||
Actuarial gains |
(27 | ) | (44 | ) | (25 | ) | (114 | ) | |||||
Benefits paid from fund |
(153 | ) | (136 | ) | (43 | ) | (43 | ) | |||||
Benefits paid directly by Company |
(6 | ) | (5 | ) | — | (1 | ) | ||||||
Exchange rate changes |
— | — | (325 | ) | 29 | ||||||||
Other |
— | 1 | — | (63 | ) | ||||||||
Benefit obligations at end of year |
$ | 1,949 | $ | 1,959 | $ | 861 | $ | 1,155 | |||||
Change in plan assets |
|||||||||||||
Fair value of plan assets at beginning of year |
$ | 1,949 | $ | 1,806 | $ | 1,217 | $ | 1,060 | |||||
Actual return on plan assets |
(383 | ) | 191 | (175 | ) | 64 | |||||||
Company contributions |
70 | 88 | 36 | 154 | |||||||||
Plan participants' contributions |
— | — | 1 | 2 | |||||||||
Benefits paid |
(153 | ) | (136 | ) | (43 | ) | (43 | ) | |||||
Exchange rate changes |
— | — | (291 | ) | 25 | ||||||||
Other |
1 | — | — | (45 | ) | ||||||||
Fair value of plan assets at end of year |
$ | 1,484 | $ | 1,949 | $ | 745 | $ | 1,217 | |||||
Funded status (including underfunded and nonfunded plans) at end of year |
$ | (465 | ) | $ | (10 | ) | $ | (116 | ) | $ | 62 | ||
Company contributions after measurement date |
— | — | — | 7 | |||||||||
Net amount recognized |
$ | (465 | ) | $ | (10 | ) | $ | (116 | ) | $ | 69 | ||
Amounts recognized in consolidated balance sheets |
|||||||||||||
Other assets—long-term assets |
$ | — | $ | 136 | $ | — | $ | 69 | |||||
Accrued compensation, benefits and retirement costs—current liabilities |
(7 | ) | (6 | ) | — | — | |||||||
Pensions—long-term liabilities |
(458 | ) | (140 | ) | (116 | ) | — | ||||||
Net amount recognized |
$ | (465 | ) | $ | (10 | ) | $ | (116 | ) | $ | 69 | ||
Amounts recognized in accumulated other comprehensive loss consist of: |
|||||||||||||
Net actuarial loss |
$ | 837 | $ | 341 | $ | 322 | $ | 226 | |||||
Prior service (credit) cost |
(8 | ) | (9 | ) | 8 | 14 | |||||||
Net amount recognized |
$ | 829 | $ | 332 | $ | 330 | $ | 240 | |||||
In addition to the pension plans in the above table, we also maintain less significant defined benefit pension plans in 12 other countries outside the U.S. and the U.K. that comprise less than three
97
CUMMINS INC. AND SUBSIDIARIES
NOTES TO CONSOLIDATED FINANCIAL STATEMENTS (Continued)
NOTE 11. PENSION AND OTHER POSTRETIREMENT BENEFITS (Continued)
percent of our pension plan assets and obligations. These plans are reflected in "Other liabilities and deferred revenue" on our Consolidated Balance Sheets. In the table above, "Other" primarily represents the transfer of several insignificant pension plans to "Other liabilities and deferred revenue" in 2007.
The following table presents information regarding underfunded pension plans that are included in the preceding table:
| |
U.S. Plans | Non-U.S. Plans | ||||||||||||
|---|---|---|---|---|---|---|---|---|---|---|---|---|---|---|
| |
December 31, | |||||||||||||
| |
2008 | 2007 | 2008 | 2007 | ||||||||||
| |
in millions |
|||||||||||||
Total accumulated benefit obligation |
$ | 1,931 | $ | 1,938 | $ | 810 | $ | 1,083 | ||||||
Plans with accumulated benefit obligation in excess of plan assets: |
||||||||||||||
Accumulated benefit obligation |
1,931 | 126 | 810 | — | ||||||||||
Fair value of plan assets |
1,484 | — | 745 | — | ||||||||||
Plans with projected benefit obligation in excess of plan assets: |
||||||||||||||
Projected benefit obligation |
1,949 | 146 | 861 | — | ||||||||||
Fair value of plan assets |
1,484 | — | 745 | — | ||||||||||
Components of Net Periodic Pension Cost
The following table presents the net periodic pension cost under our plans:
| |
U.S. Plans | Non-U.S. Plans | |||||||||||||||||
|---|---|---|---|---|---|---|---|---|---|---|---|---|---|---|---|---|---|---|---|
| |
2008 | 2007 | 2006 | 2008 | 2007 | 2006 | |||||||||||||
| |
in millions |
||||||||||||||||||
Service cost |
$ | 48 | $ | 45 | $ | 48 | $ | 26 | $ | 33 | $ | 31 | |||||||
Interest cost |
115 | 107 | 106 | 65 | 63 | 53 | |||||||||||||
Expected return on plan assets |
(150 | ) | (140 | ) | (127 | ) | (73 | ) | (71 | ) | (54 | ) | |||||||
Amortization of prior service cost (credit) |
(1 | ) | (1 | ) | 3 | 3 | 4 | 3 | |||||||||||
Recognized net actuarial loss |
20 | 33 | 38 | 19 | 26 | 19 | |||||||||||||
Other |
(1 | ) | — | (1 | ) | — | (1 | ) | 1 | ||||||||||
Net periodic benefit cost |
$ | 31 | $ | 44 | $ | 67 | $ | 40 | $ | 54 | $ | 53 | |||||||
98
CUMMINS INC. AND SUBSIDIARIES
NOTES TO CONSOLIDATED FINANCIAL STATEMENTS (Continued)
NOTE 11. PENSION AND OTHER POSTRETIREMENT BENEFITS (Continued)
Other changes in benefit obligations and plan assets recognized in other comprehensive income in 2008 and 2007 are as follows:
| |
2008 | 2007 | |||||
|---|---|---|---|---|---|---|---|
| |
in millions |
||||||
Amortization of prior service cost |
$ | (2 | ) | $ | (3 | ) | |
Recognized actuarial loss |
(39 | ) | (59 | ) | |||
Incurred actuarial loss (gain) |
756 | (205 | ) | ||||
Incurred prior service cost |
— | 1 | |||||
Foreign exchange translation adjustments |
(56 | ) | 48 | ||||
Other |
— | (3 | ) | ||||
Total recognized in other comprehensive income |
659 | (221 | ) | ||||
Total recognized in net periodic benefit cost and other comprehensive income |
$ | 730 | $ | (123 | ) | ||
The amounts in accumulated other comprehensive loss that are expected to be recognized as components of net periodic benefit cost (credit) during the next fiscal year are as follows:
| |
2009 | |||
|---|---|---|---|---|
| |
in millions |
|||
Prior service cost |
$ | 2 | ||
Net actuarial loss |
45 | |||
The table below presents various assumptions used in determining the pension benefit obligation for each year and reflects weighted-average percentages for the various plans (Non-U.S. is the U.K.):
| |
U.S. Plans | Non-U.S. Plans | |||||||||||
|---|---|---|---|---|---|---|---|---|---|---|---|---|---|
| |
2008 | 2007 | 2008 | 2007 | |||||||||
Discount rate |
6.20 | % | 6.10 | % | 6.20 | % | 5.80 | % | |||||
Compensation increase rate |
4.00 | % | 4.00 | % | 4.25 | % | 4.25 | % | |||||
The table below presents various assumptions used in determining the net periodic pension cost and reflects weighted-average percentages for the various plans (Non-U.S. is the U.K.):
| |
U.S. Plans | Non-U.S. Plans | |||||||||||||||||
|---|---|---|---|---|---|---|---|---|---|---|---|---|---|---|---|---|---|---|---|
| |
2008 | 2007 | 2006 | 2008 | 2007 | 2006 | |||||||||||||
Discount rate |
6.10 | % | 5.60 | % | 5.60 | % | 5.80 | % | 4.96 | % | 4.95 | % | |||||||
Expected return on plan assets |
8.25 | % | 8.50 | % | 8.50 | % | 7.25 | % | 7.24 | % | 7.24 | % | |||||||
Compensation increase rate |
4.00 | % | 4.00 | % | 4.00 | % | 4.25 | % | 4.02 | % | 3.75 | % | |||||||
99
CUMMINS INC. AND SUBSIDIARIES
NOTES TO CONSOLIDATED FINANCIAL STATEMENTS (Continued)
NOTE 11. PENSION AND OTHER POSTRETIREMENT BENEFITS (Continued)
The plan assets for our defined benefit pension plans do not include any of our common stock. The table below presents our pension plan asset allocation at December 31, 2008, 2007 and target allocation for 2009:
| |
Target Allocation |
Percentage of Plan Assets at December 31, |
|||||||||
|---|---|---|---|---|---|---|---|---|---|---|---|
Investment description
|
2009 | 2008 | 2007 | ||||||||
Equity securities |
55-60 | % | 56.0 | % | 63.5 | % | |||||
Fixed income |
30-35 | % | 39.6 | % | 32.3 | % | |||||
Real estate/Other |
7-10 | % | 4.4 | % | 4.2 | % | |||||
Total |
100.0 | % | 100.0 | % | |||||||
Estimated Future Contributions and Benefit Payments
We plan to contribute approximately $125 million to $135 million to our defined benefit pension plans in 2009. The table below presents expected future benefit payments under our pension plans:
| |
2009 | 2010 | 2011 | 2012 | 2013 | 2014-2018 | |||||||||||||
|---|---|---|---|---|---|---|---|---|---|---|---|---|---|---|---|---|---|---|---|
| |
in millions |
||||||||||||||||||
Expected benefit payments |
$ | 226 | $ | 193 | $ | 198 | $ | 205 | $ | 205 | $ | 1,071 | |||||||
We also sponsor defined contribution plans for certain hourly and salaried employees. We incurred expenses related to our contributions to these plans of $30 million, $25 million, and $27 million for the years ended December 31, 2008, 2007 and 2006.
Our other postretirement benefit plans provide various health care and life insurance benefits to eligible employees, who retire and satisfy certain age and service requirements, and their dependents. The plans are contributory and contain cost-sharing features such as caps, deductibles, coinsurance and spousal contributions. Company contributions are limited by formulas in each plan. Retiree contributions for health care benefits are adjusted annually and we reserve the right to change benefits covered under these plans. There were no plan assets for the postretirement benefit plans as our policy is to fund benefits and expenses for these plans as claims and premiums are incurred. We have adopted the measurement date provisions of SFAS 158, effective January 1, 2008. The majority of our other postretirement plans previously used a November 30 measurement date. All plans are now measured at December 31, consistent with the company's fiscal year end. The non-cash effect of the adoption of the measurement date provisions of SFAS 158 was not material to our financial position or our results of operations.
100
CUMMINS INC. AND SUBSIDIARIES
NOTES TO CONSOLIDATED FINANCIAL STATEMENTS (Continued)
NOTE 11. PENSION AND OTHER POSTRETIREMENT BENEFITS (Continued)
The following tables present the changes in the benefit obligations, the funded status of the plans and the amounts recognized in our Consolidated Balance Sheets for our significant other postretirement benefit plans. Benefit obligation balances presented below reflect the accumulated postretirement benefit obligations (APBO) for our other postretirement benefit plans.
| |
2008 | 2007 | |||||
|---|---|---|---|---|---|---|---|
| |
in millions |
||||||
Change in benefit obligations |
|||||||
Benefit obligations at beginning of year |
$ | 545 | $ | 577 | |||
Service cost |
1 | 1 | |||||
Interest cost |
34 | 31 | |||||
Amendments |
(2 | ) | — | ||||
Actuarial gains |
(19 | ) | (15 | ) | |||
Benefits paid directly by Company |
(56 | ) | (48 | ) | |||
Other |
— | (1 | ) | ||||
Benefit obligations at end of year |
$ | 503 | $ | 545 | |||
Funded status at end of year |
$ | (503 | ) | $ | (545 | ) | |
Amounts recognized in consolidated balance sheets |
|||||||
Accrued compensation, benefits and retirement costs—current liabilities |
$ | (51 | ) | $ | (52 | ) | |
Postretirement benefits other than pensions—long-term liabilities |
(452 | ) | (493 | ) | |||
Net amount recognized |
$ | (503 | ) | $ | (545 | ) | |
Amounts recognized in accumulated other comprehensive loss consist of: |
|||||||
Net actuarial loss |
$ | 20 | $ | 38 | |||
Prior service credit |
(30 | ) | (40 | ) | |||
Net amount recognized |
$ | (10 | ) | $ | (2 | ) | |
101
CUMMINS INC. AND SUBSIDIARIES
NOTES TO CONSOLIDATED FINANCIAL STATEMENTS (Continued)
NOTE 11. PENSION AND OTHER POSTRETIREMENT BENEFITS (Continued)
Components of Net Periodic Other Postretirement Benefits Cost
The following table presents the net periodic other postretirement benefits cost under our plans:
| |
2008 | 2007 | 2006 | |||||||
|---|---|---|---|---|---|---|---|---|---|---|
| |
in millions |
|||||||||
Service cost |
$ | 1 | $ | 1 | $ | 1 | ||||
Interest cost |
31 | 31 | 32 | |||||||
Amortization of prior service credit |
(10 | ) | (10 | ) | (10 | ) | ||||
Recognized net actuarial gain |
(1 | ) | (1 | ) | (1 | ) | ||||
Other |
— | (1 | ) | (1 | ) | |||||
Net periodic benefit cost |
$ | 21 | $ | 20 | $ | 21 | ||||
Other changes in benefit obligations recognized in other comprehensive income in 2008 and 2007 are as follows:
| |
2008 | 2007 | |||||
|---|---|---|---|---|---|---|---|
| |
in millions |
||||||
Amortization of prior service credit |
$ | 10 | $ | 10 | |||
Recognized actuarial gain |
1 | 1 | |||||
Incurred actuarial gain |
(20 | ) | (15 | ) | |||
Incurred prior service cost |
(2 | ) | — | ||||
Other |
(2 | ) | — | ||||
Total recognized in other comprehensive income |
(13 | ) | (4 | ) | |||
Total recognized in net periodic benefit cost and other comprehensive income |
$ | 8 | $ | 16 | |||
102
CUMMINS INC. AND SUBSIDIARIES
NOTES TO CONSOLIDATED FINANCIAL STATEMENTS (Continued)
NOTE 11. PENSION AND OTHER POSTRETIREMENT BENEFITS (Continued)
The amount in accumulated other comprehensive loss that is expected to be recognized as a component of net periodic credit during the next fiscal year is a prior service credit of $9 million.
The table below presents assumptions used in determining the other postretirement benefit obligation for each year and reflects weighted-average percentages for our other postretirement plans:
| |
2008 | 2007 | |||||
|---|---|---|---|---|---|---|---|
Discount rate |
6.20 | % | 6.00 | % | |||
The table below presents assumptions used in determining the net periodic other postretirement benefits cost and reflects weighted-average percentages for the various plans:
| |
2008 | 2007 | 2006 | |||||||
|---|---|---|---|---|---|---|---|---|---|---|
Discount rate |
6.00 | % | 5.60 | % | 5.60 | % | ||||
Our consolidated other postretirement benefit obligation is determined by application of the terms of health care and life insurance plans, together with relevant actuarial assumptions and health care cost trend rates. For measurement purposes, an 8.33 percent annual rate of increase in the per capita cost of covered health care benefits was assumed in 2009. The rate was assumed to decrease on a linear basis to 5.0 percent through 2014 and remain at that level thereafter. An increase in the health care cost trends of 1 percent would increase our APBO by $19 million as of December 31, 2008 and the net periodic other postretirement benefit expense for 2009 by $1 million. A decrease in the health care cost trends of 1 percent would decrease our APBO by $17 million as of December 31, 2008 and the net periodic other postretirement benefit expense for 2009 by $1 million.
The Medicare Prescription Drug Improvement and Modernization Act of 2003 was reflected in the APBO beginning December 31, 2004, assuming we will continue to provide a prescription drug benefit to retirees that is at least actuarially equivalent to Medicare Part D and we will receive the federal subsidy.
Estimated Future Benefit Payments
The table below presents expected future benefit payments under our other postretirement benefit plans:
| |
2009 | 2010 | 2011 | 2012 | 2013 | 2014-2018 | |||||||||||||
|---|---|---|---|---|---|---|---|---|---|---|---|---|---|---|---|---|---|---|---|
| |
in millions |
||||||||||||||||||
Expected benefit payments, net of Medicare Part D subsidy—postretirement |
53 | 53 | 53 | 51 | 49 | 209 | |||||||||||||
Medicare Part D subsidy |
4 | 5 | 5 | 6 | 6 | 35 | |||||||||||||
103
CUMMINS INC. AND SUBSIDIARIES
NOTES TO CONSOLIDATED FINANCIAL STATEMENTS (Continued)
NOTE 12. PRODUCT WARRANTY LIABILITY
A summary of the activity in our warranty liability account, which includes warranty provisions and payments, changes in our estimates for pre-existing warranties and changes in our deferred revenue balances associated with extended warranty programs is as follows:
| |
December 31, | ||||||
|---|---|---|---|---|---|---|---|
| |
2008 | 2007 | |||||
| |
in millions |
||||||
Balance, beginning of year |
$ | 749 | $ | 652 | |||
Provision for warranties issued |
413 | 403 | |||||
Deferred revenue on extended warranty contracts sold |
103 | 66 | |||||
Payments |
(383 | ) | (328 | ) | |||
Amortization of deferred revenue on extended warranty contracts |
(64 | ) | (51 | ) | |||
Changes in estimates for pre-existing warranties |
177 | 2 | |||||
Foreign currency translation |
(33 | ) | 5 | ||||
Balance, end of year |
$ | 962 | $ | 749 | |||
The current portion of our warranty balance is presented as "Current portion of accrued product warranty" and the remaining balance is included in "Other liabilities and deferred revenue" on our Consolidated Balance Sheets. The amount of deferred revenue related to extended warranty programs at December 31, 2008 and 2007, was $224 million and $180 million, respectively.
NOTE 13. COMMITMENTS AND CONTINGENCIES
We are subject to numerous lawsuits and claims arising out of the ordinary course of our business, including actions related to product liability; personal injury; the use and performance of our products; warranty matters; patent, trademark or other intellectual property infringement; contractual liability; the conduct of our business; tax reporting in foreign jurisdictions; distributor termination; workplace safety; and environmental matters. We also have been identified as a potentially responsible party at multiple waste disposal sites under federal and related state environmental statutes and regulations and may have joint and several liability for any investigation and remediation costs incurred with respect to such sites. Some of these lawsuits, claims and proceedings involve substantial amounts. We have denied liability with respect to many of these lawsuits, claims and proceedings and are vigorously defending such lawsuits, claims and proceedings. We carry various forms of commercial, property and casualty, product liability and other forms of insurance; however, such insurance may not be applicable or adequate to cover the costs associated with a judgment against us with respect to these lawsuits, claims and proceedings. We do not believe that these lawsuits are material individually or in the aggregate. While we believe we have also established adequate accruals for our expected future liability with respect to pending lawsuits, claims and proceedings, where the nature and extent of any such liability can be reasonably estimated based upon then presently available information, there can be no assurance that the final resolution of any existing or future lawsuits, claims or proceedings will not have a material adverse effect on our business, results of operation, financial condition or cash flows.
Since 1997 we have had an operating agreement with a financial institution that requires us to guarantee revolving loans, equipment term loans and leases, real property loans and letters of credit
104
CUMMINS INC. AND SUBSIDIARIES
NOTES TO CONSOLIDATED FINANCIAL STATEMENTS (Continued)
NOTE 13. COMMITMENTS AND CONTINGENCIES (Continued)
made by the financial institution to certain independent Cummins and Onan distributors in the U.S., and to certain distributors in which we own an equity interest. In the first quarter of 2006, we amended, restated and simplified the terms of the operating agreement and removed the Cummins guarantee of distributor borrowings.
If any distributor defaults under its financing arrangement with the financial institution, and the maturity of amounts owed under the agreement is accelerated, then we are required to purchase from the financial institution, at amounts approximating fair market value, certain property, inventory and rental generator sets manufactured by Cummins that are secured by the distributor's financing agreement.
The operating agreement will continue to be in effect until February 7, 2010 and is subject to an automatic one year renewal without requiring the action of either party.
We have various residual value guarantees on equipment leased under operating leases. The total amount of these residual value guarantees at December 31, 2008, was $8 million.
Other Guarantees and Commitments
In addition to the guarantees discussed above, from time to time we enter into other guarantee arrangements, including guarantees of non-U.S. distributor financing and other miscellaneous guarantees of third-party obligations. The maximum potential loss related to these other guarantees is $37 million ($33 million of which relates to the Beijing Foton discussion below) at December 31, 2008.
We have arrangements with certain suppliers that require us to purchase minimum volumes or be subject to monetary penalties. The penalty amounts are less than our purchase commitments and essentially allow the supplier to recover their tooling costs in most instances. At December 31, 2008, if we were to stop purchasing from each of these suppliers, the amount of the penalty would be approximately $95 million, of which $82 million relates to a six year contract with an engine parts supplier that extends from 2008 to 2013. Based on current forecasts, we do not anticipate paying any penalties under these contracts. This arrangement enables us to secure critical components important to our growth.
In July 2008, Beijing Foton Cummins Engine Company, a 50 percent owned entity accounted for under the equity method, entered into a line of credit agreement with a borrowing capacity of up to $176 million (at current exchange rates). The line will be used primarily to fund equipment purchases for a new manufacturing plant. As a part of this transaction, we guaranteed 50 percent of any outstanding borrowings up to a maximum guarantee of $88 million (at current exchange rates). As of December 31, 2008, outstanding borrowings under this agreement were $65 million and our guarantee was $33 million (at current exchange rates). We recorded a liability for the fair value of this guarantee in accordance with FASB Interpretation No. 45, "Guarantor's Accounting and Disclosure Requirements for Guarantees, Including Indirect Guarantees of Indebtedness of Others—an interpretation of FASB Statements No. 5, 57, and 107 and rescission of FASB Interpretation No. 34." The amount of the liability was less than $1 million. The offset to this liability was an increase in our investment in the joint venture.
105
CUMMINS INC. AND SUBSIDIARIES
NOTES TO CONSOLIDATED FINANCIAL STATEMENTS (Continued)
NOTE 13. COMMITMENTS AND CONTINGENCIES (Continued)
In October 2008, we entered into a commitment with Irwin Financial Corporation (Irwin) to purchase up to $25 million of its common shares. Under the terms of the agreement, the actual amount of the shares to be purchased will be determined at the conclusion of a potential rights offering being planned by Irwin. Cummins and several other parties have agreed to purchase any unsubscribed shares from the rights offering subject to a maximum commitment. Our commitment will be limited to the lesser of (1) the amount of unsubscribed shares from the rights offering that are allocated to us, (2) $25 million, or (3) an amount which will ensure that our ownership percentage does not exceed 19.9 percent. William I. Miller, Chairman and Chief Executive Officer of Irwin, is currently a member of the board of directors of Cummins and has agreed to resign from that position if the Company exercises its standby commitment in full or in part. Mr. Miller has no effective control over the Company's exercise of its standby commitment.
Periodically, we enter into various contractual arrangements where we agree to indemnify a third-party against certain types of losses. Common types of indemnifications include:
We regularly evaluate the probability of having to incur costs associated with these indemnifications and accrue for expected losses that are probable. Because the indemnifications are not related to specified known liabilities and due to their uncertain nature, we are unable to estimate the maximum amount of the potential loss associated with these indemnifications.
As of December 31, 2008, we have committed to invest $2 million into existing joint ventures and joint ventures that will be formed in 2009. It is expected that $2 million will be funded in 2009.
106
CUMMINS INC. AND SUBSIDIARIES
NOTES TO CONSOLIDATED FINANCIAL STATEMENTS (Continued)
Minority shareholders' interests in the equity of consolidated subsidiaries are as follows:
| |
December 31, | ||||||
|---|---|---|---|---|---|---|---|
| |
2008 | 2007 | |||||
| |
in millions |
||||||
Cummins India Ltd. |
$ | 165 | $ | 167 | |||
Consolidated Diesel Company(1) |
— | 54 | |||||
Wuxi Holset Engineering Co. Ltd. |
28 | 23 | |||||
All others |
57 | 49 | |||||
Total |
$ | 250 | $ | 293 | |||
During the second quarter of 2008 our shareholders ratified a proposal to increase our common stock authorization to 500 million shares. The Board of Directors authorized a pair of two-for-one splits of Cummins stock in 2007, which were distributed on April 9, 2007 and January 2, 2008, to shareholders of record as of March 26, 2007 and December 21, 2007, respectively. All share and per share amounts in this Form 10-K have been adjusted to reflect the two-for-one stock splits. During the second quarter of 2007 our shareholders ratified a proposal to increase our common stock authorization to 300 million shares.
Changes in shares of common stock, treasury stock and common stock held in trust for employee benefit plans are as follows:
| |
Common Stock |
Treasury Stock |
Common Stock Held in Trust |
||||||||
|---|---|---|---|---|---|---|---|---|---|---|---|
| |
in millions |
||||||||||
Balance at December 31, 2005 |
193.8 | 8.0 | 8.0 | ||||||||
Shares acquired |
— | 4.4 | — | ||||||||
Shares issued |
26.5 | (0.8 | ) | — | |||||||
Other shareholder transactions |
(0.3 | ) | — | (0.4 | ) | ||||||
Balance at December 31, 2006 |
220.0 | 11.6 | 7.6 | ||||||||
Shares acquired |
— | 6.0 | — | ||||||||
Shares issued |
0.8 | (0.2 | ) | — | |||||||
Employee benefits trust activity |
— | 0.8 | (1.1 | ) | |||||||
Other shareholder transactions |
(0.4 | ) | — | — | |||||||
Balance at December 31, 2007 |
220.4 | 18.2 | 6.5 | ||||||||
Shares acquired |
— | 2.3 | — | ||||||||
Shares issued |
1.6 | (0.1 | ) | — | |||||||
Employee benefits trust activity |
— | — | (1.4 | ) | |||||||
Other shareholder transactions |
(0.3 | ) | — | — | |||||||
Balance at December 31, 2008 |
221.7 | 20.4 | 5.1 | ||||||||
107
CUMMINS INC. AND SUBSIDIARIES
NOTES TO CONSOLIDATED FINANCIAL STATEMENTS (Continued)
NOTE 15. SHAREHOLDERS' EQUITY (Continued)
In July 2008, the Board of Directors voted to increase the quarterly cash dividend per common share by 40 percent and increased cash dividends to $0.175 per common share in the third and fourth quarters of 2008.
In July 2007, the Board of Directors voted to increase the quarterly cash dividend per share by 39 percent and increased cash dividends to $0.125 per common share in the third and fourth quarters of 2007. Dividends per share paid to common shareholders for the years ended December 31, were as follows:
| |
Quarterly Dividends | |||||||||
|---|---|---|---|---|---|---|---|---|---|---|
| |
2008 | 2007 | 2006 | |||||||
First Quarter |
$ | 0.125 | $ | 0.09 | $ | 0.075 | ||||
Second Quarter |
0.125 | 0.09 | 0.075 | |||||||
Third Quarter |
0.175 | 0.125 | 0.09 | |||||||
Fourth Quarter |
0.175 | 0.125 | 0.09 | |||||||
Total dividends paid to common shareholders for the years ended December 31, 2008, 2007 and 2006 were $122 million, $89 million, and $66 million, respectively. Declaration and payment of dividends in the future depends upon income and liquidity position, among other factors.
Preferred and Preference Stock
We are authorized to issue one million shares each of zero par value preferred and preference stock with preferred shares being senior to preference shares. We can determine the number of shares of each series, and the rights, preferences and limitations of each series. At December 31, 2008, there was no preferred or preference stock outstanding.
Shares of common stock repurchased by us are recorded at cost as treasury stock and result in a reduction of shareholders' equity in our Consolidated Balance Sheets. From time to time, treasury shares may be reissued as part of our stock-based compensation programs. When shares are reissued, we use the weighted-average cost method for determining cost. The gains between the cost of the shares and the issuance price are added to additional paid-in-capital. The losses are deducted from additional paid-in capital to the extent of the gains. Thereafter, the losses are deducted from retained earnings.
Treasury stock activity for the three-year period ended December 31, 2008, consisting of shares issued and purchased is presented in the Consolidated Statements of Shareholders' Equity. In July 2006, the Board of Directors authorized us to acquire up to eight million shares of Cummins common stock in addition to what was acquired under previous authorizations. For the year ended December 31, 2007, we repurchased $335 million of common stock, which concluded the share repurchase program authorized by the Board of Directors in July 2006. In 2007, we also converted 0.8 million shares from our Employee Benefit Trust into treasury stock. These shares are not considered purchases under the Board authorized purchase plan. In December 2007, the Board of Directors authorized the acquisition of up to $500 million worth of Cummins common stock. For the year ended December 31, 2008, we
108
CUMMINS INC. AND SUBSIDIARIES
NOTES TO CONSOLIDATED FINANCIAL STATEMENTS (Continued)
NOTE 15. SHAREHOLDERS' EQUITY (Continued)
repurchased $128 million of common stock under the share repurchase program authorized by the Board of Directors in December of 2007.
We announced in February 2009 that we have temporarily suspended our stock repurchase program to conserve cash.
We have an Employee Stock Ownership Plan (ESOP) Trust that was established in 1989 for certain domestic salaried and non-bargained employees participating in our 401(k) Retirement and Savings Plan (RSP). The ESOP has a note payable to us which will be funded through future Company contributions to the ESOP Trust.
Our annual cash contributions during plan year 2008, 2007 and 2006 along with dividends received on unallocated shares of our common stock held by the ESOP Trust and cash contributions from the Employee Benefit Trust were equal to the required principal and interest payments due under the ESOP notes and amounted to $9 million, $10 million and $9 million, respectively. Dividends received on allocated ESOP shares are used to purchase shares of our common stock from the Employee Benefit Trust. Those shares are then allocated to the participant accounts. As the debt is repaid, shares are released from the ESOP and are allocated to participants in proportion to their contributions to the RSP. Compensation expense is recorded as shares are allocated to plan participants each year and reduced by the common stock dividends received by the ESOP Trust. Unearned compensation is included in shareholders' equity and represents compensation expense which will be recorded in the future as the remaining shares are allocated to participants. All shares issued to the ESOP Trust are considered outstanding for purposes of computing earnings per share. Dividends on unallocated ESOP shares used to service a portion of the principal and interest due on the ESOP notes were $1 million for each of the years ended December 31, 2008, 2007 and 2006. Annual compensation expense for the ESOP was $3 million, $4 million, and $3 million for the years ended December 31, 2008, 2007 and 2006. At December 31, 2008, the ESOP Trust held 2,573,985 shares allocated to participants, 621,371 unreleased and unallocated shares and 3,207 committed to be allocated shares.
In 1997, we established the Employee Benefits Trust (EBT) funded with common stock for use in meeting our future obligations under employee benefit and compensation plans. The primary sources of cash for the EBT are dividends received on unallocated shares of our common stock held by the EBT. In addition to shares of our common stock held in ESOP, the EBT may be used to fund matching contributions to employee accounts in the RSP made in proportion to employee contributions under the terms of the RSP. Contributions charged to income were $2.5 million in 2008, not material in 2007 and $9 million in 2006. In 2008, we sold 1.4 million shares on the open market, and in 2007 we converted 0.8 million shares into treasury stock at its fair value and sold 0.3 million shares on the open market from the EBT and used the $63 million and $66 million of proceeds, respectively, to fund other non-qualified employee benefit plans.
109
CUMMINS INC. AND SUBSIDIARIES
NOTES TO CONSOLIDATED FINANCIAL STATEMENTS (Continued)
NOTE 15. SHAREHOLDERS' EQUITY (Continued)
Other Comprehensive (Loss) Income
Following are the items included in other comprehensive (loss) income and the related tax effects:
| |
Before Tax Amount |
Tax (Provision) Benefit |
After Tax Amount |
||||||||
|---|---|---|---|---|---|---|---|---|---|---|---|
| |
in millions |
||||||||||
Year ended December 31, 2008 |
|||||||||||
Change in pensions and other postretirement defined benefit plans |
$ | (643 | ) | $ | 225 | $ | (418 | ) | |||
Foreign currency translation adjustments |
(312 | ) | 23 | (289 | ) | ||||||
Unrealized loss on marketable securities: |
|||||||||||
Holding loss |
(3 | ) | 1 | (2 | ) | ||||||
Reclassification of realized gain to net income |
(2 | ) | — | (2 | ) | ||||||
Net unrealized loss |
(5 | ) | 1 | (4 | ) | ||||||
Unrealized loss on derivatives: |
|||||||||||
Holding loss |
(92 | ) | 25 | (67 | ) | ||||||
Reclassification of realized gain to net income |
(5 | ) | 2 | (3 | ) | ||||||
Net unrealized loss |
(97 | ) | 27 | (70 | ) | ||||||
Total other comprehensive loss |
$ | (1,057 | ) | $ | 276 | $ | (781 | ) | |||
Year ended December 31, 2007 |
|||||||||||
Change in pensions and other postretirement defined benefit plans |
$ | 225 | $ | (92 | ) | $ | 133 | ||||
Foreign currency translation adjustments |
134 | (27 | ) | 107 | |||||||
Unrealized gain on marketable securities: |
|||||||||||
Holding gain |
7 | (2 | ) | 5 | |||||||
Reclassification of realized gain to net income |
(1 | ) | — | (1 | ) | ||||||
Net unrealized gain |
6 | (2 | ) | 4 | |||||||
Unrealized loss on derivatives: |
|||||||||||
Holding gain |
19 | (7 | ) | 12 | |||||||
Reclassification of realized gain to net income |
(26 | ) | 9 | (17 | ) | ||||||
Net unrealized loss |
(7 | ) | 2 | (5 | ) | ||||||
Total other comprehensive income |
$ | 358 | $ | (119 | ) | $ | 239 | ||||
Year ended December 31, 2006 |
|||||||||||
Minimum pension liability adjustment |
$ | 154 | $ | (52 | ) | $ | 102 | ||||
Foreign currency translation adjustments |
72 | (9 | ) | 63 | |||||||
Unrealized loss on marketable securities |
(2 | ) | 1 | (1 | ) | ||||||
Unrealized gain on derivatives: |
|||||||||||
Holding gain |
36 | (12 | ) | 24 | |||||||
Reclassification of realized gain to net income |
(25 | ) | 8 | (17 | ) | ||||||
Net unrealized gain |
11 | (4 | ) | 7 | |||||||
Total other comprehensive income |
$ | 235 | $ | (64 | ) | $ | 171 | ||||
110
CUMMINS INC. AND SUBSIDIARIES
NOTES TO CONSOLIDATED FINANCIAL STATEMENTS (Continued)
NOTE 16. STOCK INCENTIVE AND STOCK OPTION PLANS
In September 2003, our shareholders approved the 2003 Stock Incentive Plan (The Plan). The Plan allows for the granting of up to 10.0 million stock-based awards to executives and employees. Awards available for grant under the plan include, but are not limited to, stock options, stock appreciation rights, performance shares, restricted stock and other stock awards. Stock options are generally granted with a strike price equal to the fair market value of the stock on the date of grant, a life of 10 years and a two-year vesting period.
The performance shares are granted as target awards and are earned based on our return on equity (ROE) performance. A payout factor has been established ranging from zero to 200 percent of the target award based on the actual ROE performance during the two-year period. Any shares earned are then restricted for one additional year. Employees leaving the company prior to the end of the restriction period forfeit their shares. Compensation expense is recorded ratably over the period beginning on the grant date until the shares become unrestricted and is based on the amount of the award that is expected to be earned under the plan formula, adjusted each reporting period based on current information.
Under the stock incentive plan, restricted common stock is awarded from time to time at no cost to certain Directors and employees. Participants are entitled to cash dividends and voting rights. Restrictions limit the sale or transfer of the shares during a defined period. Generally, one-third of the shares are released after two years and one-third of the shares issued are released each year thereafter on the anniversary of the grant date, provided the participant remains an employee. Compensation expense is determined at the grant date and is recognized over the four-year restriction period on a straight-line basis.
Compensation expense (net of estimated forfeitures) related to our share-based plans for the year ended December 31, 2008, 2007 and 2006 was approximately $28 million, $28 million, and $18 million, respectively. The excess tax benefit associated with our share-based plans for the years ended December 31, 2008, 2007 and 2006, was $13 million, $11 million and $6 million, respectively. The total unrecognized compensation expense (net of estimated forfeitures) related to nonvested awards was approximately $20 million at December 31, 2008 and was expected to be recognized over a weighted-average period of less than one year.
111
CUMMINS INC. AND SUBSIDIARIES
NOTES TO CONSOLIDATED FINANCIAL STATEMENTS (Continued)
NOTE 16. STOCK INCENTIVE AND STOCK OPTION PLANS (Continued)
The table below summarizes the activity in our stock option plans:
| |
Options | Weighted-average Exercise Price |
||||||
|---|---|---|---|---|---|---|---|---|
Balance, December 31, 2005 |
1,598,800 | $ | 11.15 | |||||
Granted |
1,800 | 26.31 | ||||||
Exercised |
(762,240 | ) | 11.45 | |||||
Expired |
(6,600 | ) | 10.16 | |||||
Balance, December 31, 2006 |
831,760 | $ | 10.91 | |||||
Granted |
21,000 | 49.42 | ||||||
Exercised |
(235,310 | ) | 11.73 | |||||
Forfeited |
(69,700 | ) | 10.11 | |||||
Expired |
(15,000 | ) | 13.25 | |||||
Balance, December 31, 2007 |
532,750 | $ | 12.10 | |||||
Granted |
105,350 | 27.34 | ||||||
Exercised |
(188,120 | ) | 11.21 | |||||
Forfeited |
(5,400 | ) | 9.93 | |||||
Expired |
(4,500 | ) | 13.92 | |||||
Balance, December 31, 2008 |
440,080 | $ | 16.14 | |||||
Exercisable, December 31, 2006 |
831,760 |
$ |
10.91 |
|||||
Exercisable, December 31, 2007 |
532,750 | $ | 12.10 | |||||
Exercisable, December 31, 2008 |
440,080 | $ | 16.14 | |||||
The weighted-average grant date fair value of options granted during the years ended December 31, 2008, 2007 and 2006, was $27.34, $49.42 and $26.31, respectively. The total intrinsic value of options exercised during the years ended December 31, 2008, 2007 and 2006, was approximately $9 million, $9 million and $14 million, respectively.
112
CUMMINS INC. AND SUBSIDIARIES
NOTES TO CONSOLIDATED FINANCIAL STATEMENTS (Continued)
NOTE 16. STOCK INCENTIVE AND STOCK OPTION PLANS (Continued)
The weighted-average grant date fair value of performance and restricted shares is as follows:
| |
Performance Shares |
Weighted- average Fair Value |
||||||
|---|---|---|---|---|---|---|---|---|
Nonvested at December 31, 2005 |
2,890,600 | $ | 14.07 | |||||
Granted |
700,592 | 24.72 | ||||||
Vested |
(987,200 | ) | 12.01 | |||||
Forfeited |
(58,812 | ) | 14.03 | |||||
Nonvested at December 31, 2006 |
2,545,180 | $ | 17.80 | |||||
Granted |
597,240 | 38.21 | ||||||
Vested |
(1,063,160 | ) | 12.56 | |||||
Forfeited |
(4,624 | ) | 27.10 | |||||
Nonvested at December 31, 2007 |
2,074,636 | $ | 26.34 | |||||
Granted |
1,038,842 | 34.95 | ||||||
Vested |
(842,300 | ) | 19.08 | |||||
Forfeited |
(64,692 | ) | 32.56 | |||||
Nonvested at December 31, 2008 |
2,206,486 | $ | 32.98 | |||||
| |
Restricted Shares |
Weighted- average Fair Value |
||||||
|---|---|---|---|---|---|---|---|---|
Nonvested at December 31, 2005 |
4,000 | $ | 18.72 | |||||
Granted |
200,000 | 26.96 | ||||||
Nonvested at December 31, 2006 |
204,000 | $ | 26.80 | |||||
Granted |
4,800 | 42.61 | ||||||
Nonvested at December 31, 2007 |
208,800 | $ | 27.16 | |||||
Vested |
(70,670 | ) | 26.49 | |||||
Nonvested at December 31, 2008 |
138,130 | $ | 27.51 | |||||
The fair value of each option grant was estimated on the grant date using the Black-Scholes option pricing model with the following assumptions:
| |
Years ended December 31, | |||||||||
|---|---|---|---|---|---|---|---|---|---|---|
| |
2008 | 2007 | 2006 | |||||||
Expected life (years) |
7 | 7 | 7 | |||||||
Risk-free interest rate |
3.2 | % | 4.4 | % | 4.9 | % | ||||
Expected volatility |
49.6 | % | 24.0 | % | 26.4 | % | ||||
Dividend yield |
1.3 | % | 1.5 | % | 1.8 | % | ||||
Expected life—The expected life of employee stock options represents the weighted-average period the stock options are expected to remain outstanding based upon our historical data.
113
CUMMINS INC. AND SUBSIDIARIES
NOTES TO CONSOLIDATED FINANCIAL STATEMENTS (Continued)
NOTE 16. STOCK INCENTIVE AND STOCK OPTION PLANS (Continued)
Risk-free interest rate—The risk-free interest rate assumption is based upon the observed U.S. treasury security rate appropriate for the expected life of our employee stock options.
Expected volatility—The expected volatility assumption is based upon the weighted-average historical daily price changes of our common stock over the most recent period equal to the expected option life of the grant, adjusted for activity which is not expected to occur in the future.
Dividend yield—The dividend yield assumption is based on our history and expectation of dividend payouts.
The table below summarizes stock option information for options outstanding, all of which are currently exercisable at December 31, 2008:
| |
Options Outstanding and Exercisable | ||||||||||||
|---|---|---|---|---|---|---|---|---|---|---|---|---|---|
Exercise Price Range
|
Number of Options |
Weighted-average Remaining Contractual Life |
Weighted-average Exercise Price |
Aggregate Intrinsic Value |
|||||||||
$0.00 - 19.305 |
336,980 | 2.9491 | $ | 11.11 | $ | 5,264,235 | |||||||
$19.3051 - 26.22 |
66,800 | 9.8541 | 22.76 | 265,488 | |||||||||
$26.2201 - 73.66 |
36,300 | 9.0733 | 50.69 | — | |||||||||
|
440,080 | 4.5024 | $ | 16.14 | $ | 5,529,723 | |||||||
We calculate basic earnings per share (EPS) of common stock by dividing net income by the weighted-average number of common shares outstanding for the period. The calculation of diluted EPS reflects the potential dilution that occurs if options or securities are exercised or debt is converted into common stock and the effect of the exercise or conversion on EPS. We exclude shares of common stock held in the EBT (see Note 15) from the calculation of the weighted-average common shares outstanding until those shares are distributed from the EBT to the RSP. Following is a reconciliation of
114
CUMMINS INC. AND SUBSIDIARIES
NOTES TO CONSOLIDATED FINANCIAL STATEMENTS (Continued)
NOTE 17. EARNINGS PER SHARE (Continued)
net income and weighted-average common shares outstanding for purposes of calculating basic and diluted earnings per share:
| |
Years ended December 31, | ||||||||||
|---|---|---|---|---|---|---|---|---|---|---|---|
| |
2008 | 2007 | 2006 | ||||||||
| |
in millions (except shares and per share amounts) |
||||||||||
Net income for basic EPS |
$ | 755.0 | $ | 739.0 | $ | 715.4 | |||||
Interest on junior convertible subordinated debentures, net of tax |
— | — | 5.9 | ||||||||
Net income for diluted EPS |
$ | 755.0 | $ | 739.0 | $ | 721.3 | |||||
Weighted-average common shares outstanding: |
|||||||||||
Basic |
194,958,370 | 198,443,501 | 190,505,324 | ||||||||
Dilutive effect of stock compensation awards |
1,572,178 | 1,454,153 | 1,583,748 | ||||||||
Dilutive effect of junior convertible subordinated debentures |
— | — | 11,017,786 | ||||||||
Diluted |
196,530,548 | 199,897,654 | 203,106,858 | ||||||||
Earnings per common share: |
|||||||||||
Basic |
$ | 3.87 | $ | 3.72 | $ | 3.76 | |||||
Diluted |
3.84 | 3.70 | 3.55 | ||||||||
The weighted-average diluted common shares outstanding for 2008 and 2007 excludes the effect of approximately 16,020 and 825 weighted-average shares, respectively, of common stock options, since such options had an exercise price in excess of the monthly average market value of our common stock during that year. In 2006, the monthly average market value of our common stock was greater than the exercise price of all our common stock options and therefore no options were excluded from our calculation of the weighted-average diluted shares outstanding.
We are exposed to financial risk resulting from volatility in foreign exchange rates, interest rates and commodity prices. This risk is closely monitored and managed through the use of financial derivative instruments including commodity forward contracts, currency forward contracts and interest rate swaps. As stated in our policies and procedures, financial derivatives are used expressly for hedging purposes, and under no circumstances are they used for speculative purposes. When material, we adjust the value of our derivative contracts for counter-party or our credit risk. The results and status of our
115
CUMMINS INC. AND SUBSIDIARIES
NOTES TO CONSOLIDATED FINANCIAL STATEMENTS (Continued)
NOTE 18. DERIVATIVES (Continued)
hedging transactions are reported to senior management on a monthly and quarterly basis. The following table summarizes our outstanding derivatives by risk category and instrument type:
| |
December 31, | |||||||||||||
|---|---|---|---|---|---|---|---|---|---|---|---|---|---|---|
| |
2008 | 2007 | ||||||||||||
| |
Notional Amount |
Fair Value |
Notional Amount |
Fair Value |
||||||||||
| |
in millions |
|||||||||||||
Foreign currency: |
||||||||||||||
Forward contracts |
$ | 677 | $ | (13 | ) | $ | 591 | $ | (2 | ) | ||||
Commodity price: |
||||||||||||||
Forward contracts |
124 | (67 | ) | 145 | 10 | |||||||||
Interest rate: |
||||||||||||||
Fixed-to-floating swap |
250 | 79 | 250 | 7 | ||||||||||
|
$ | 1,051 | $ | (1 | ) | $ | 986 | $ | 15 | |||||
Foreign Currency Exchange Rate Risks
As a result of our international business presence, we are exposed to foreign currency exchange risks. We transact business in foreign currencies and, as a result our income experiences some volatility related to movements in foreign currency exchange rates. To help manage our exposure to exchange rate volatility, we use foreign exchange forward contracts on a regular basis to hedge forecasted intercompany and third-party sales and purchases denominated in non-functional currencies. These foreign currency forward contracts are designated and qualify as foreign currency cash flow hedges under SFAS No. 133, "Accounting for Derivative Instruments and Hedging Activities" (SFAS 133), and are recorded in the Consolidated Balance Sheets at fair value in "Other accrued expenses." The effective portion of the unrealized gain or loss on the forward contract is deferred and reported as a component of "Accumulated other comprehensive loss." When the hedged forecasted transaction (sale or purchase) occurs, the unrealized gain or loss is reclassified into income in the same line item associated with the hedged transaction in the same period or periods during which the hedged transaction affects income. For the year ended December 31, 2008, losses of $13 million were reclassified from "Accumulated other comprehensive loss" to income. The amount of gain reclassified for the year ended December 31, 2007 was $5 million. The ineffective portion of the hedge, unrealized gain or loss, if any, is recognized in current income during the period of change. As of December 31, 2008, $10 million of unrealized losses, net of tax, were included in "Accumulated other comprehensive loss" in the Consolidated Balance Sheets and are expected to be reclassified to income over the next twelve months. As of December 31, 2007, $2 million of unrealized losses, net of tax, were included in "Accumulated other comprehensive loss" in the Consolidated Balance Sheets. For the years ended December 31, 2008 and 2007, there were no circumstances that would have resulted in the discontinuance of a cash flow hedge.
To minimize the income volatility resulting from the remeasurement of net monetary assets and payables denominated in foreign currency, we enter into foreign currency forward contracts. The objective is to offset the gain or loss from remeasurement with the gain or loss from the fair market valuation of the forward contract. These derivative instruments are not designated as hedges under SFAS 133.
116
CUMMINS INC. AND SUBSIDIARIES
NOTES TO CONSOLIDATED FINANCIAL STATEMENTS (Continued)
NOTE 18. DERIVATIVES (Continued)
Our internal policy allows for managing anticipated foreign currency cash flow for up to one year. As of December 31, 2008, approximately 93 percent of the notional amount of the forward contracts shown in the table above was attributable to five currencies, the British Pound (71 percent), the Euro (10 percent), the Australian Dollar (5 percent), Indian Rupee (5 percent) and the Singapore Dollar (2 percent). As of December 31, 2007, approximately 96 percent of the notional amount of the forward contracts shown in the table above was attributable to five currencies, the British Pound (61 percent), the Euro (25 percent), the Indian Rupee (4 percent), the Australian Dollar (4 percent), and the Japanese Yen (2 percent).
We are exposed to market risk from fluctuations in interest rates. We manage our exposure to interest rate fluctuations through the use of interest rate swaps. The objective of the swaps is to more effectively balance our borrowing costs and interest rate risk. Currently, we have one interest rate swap outstanding.
In November 2005, we entered into an interest rate swap to effectively convert our $250 million, due in 2028, debt from a fixed rate of 7.125% to a floating rate based on a LIBOR spread. The terms of the swap mirror those of the debt, with interest paid semi-annually. This swap qualifies as a fair value hedge under SFAS 133.
We are exposed to fluctuations in commodity prices due to contractual agreements with component suppliers. In order to protect ourselves against future price volatility and, consequently, fluctuations in gross margins, we periodically enter into commodity forward contracts with designated banks to fix the cost of certain raw material purchases with the objective of minimizing changes in inventory cost due to market price fluctuations. The forward contracts are derivative contracts that are designated as cash flow hedges under SFAS 133 and are recorded in the Consolidated Balance Sheets at fair value in "Other accrued expenses," "Other assets" and "Other liabilities and deferred revenues." The effective portion of the unrealized gain or loss is deferred and reported as a component of "Accumulated other comprehensive loss." When the hedged forecasted transaction (purchase) occurs, the unrealized gain or loss is reclassified into income in the same line item associated with the hedged transaction in the same period or periods during which the hedged transaction affects income. For the year ended December 31, 2008, gains of $18 million were reclassified from "Accumulated other comprehensive loss" to income. For the year ended December 31, 2007, gains of $21 million were reclassified from "Accumulated other comprehensive loss" to income. The ineffective portion of the hedge, if any, is recognized in current income in the period in which the ineffectiveness occurs. As of December 31, 2008 and 2007, unrealized losses and gains, net of tax, related to commodity forward contracts were $57 million and $5 million, respectively. During 2009 we expect to reclassify net losses of $29 million from "Accumulated other comprehensive loss" to income.
Our internal policy allows for managing these cash flow hedges for up to three years. For the year ended December 31, 2008, there were no material circumstances that would have resulted in the discontinuance of a cash flow hedge.
117
CUMMINS INC. AND SUBSIDIARIES
NOTES TO CONSOLIDATED FINANCIAL STATEMENTS (Continued)
We lease certain manufacturing equipment, facilities, warehouses, office space and equipment, aircraft and automobiles for varying periods under lease agreements. Most of the leases are non-cancelable operating leases with fixed rental payments, expire over the next ten years and contain renewal provisions. Rent expense under these leases approximated $129 million, $113 million and $98 million in 2008, 2007 and 2006, respectively.
Following is a summary of the future minimum lease payments due under capital and operating leases, including leases in our rental business discussed below, with terms of more than one year at December 31, 2008, together with the net present value of the minimum payments due under capital leases:
| |
Capital Leases | Operating Leases | |||||
|---|---|---|---|---|---|---|---|
| |
in millions |
||||||
2009 |
$ | 31 | $ | 54 | |||
2010 |
26 | 41 | |||||
2011 |
19 | 29 | |||||
2012 |
16 | 17 | |||||
2013 |
5 | 13 | |||||
After 2013 |
26 | 43 | |||||
Total minimum lease payments |
$ | 123 | $ | 197 | |||
Interest |
(23 | ) | |||||
Present value of net minimum lease payments |
$ | 100 | |||||
In addition, we have subleased certain of the facilities under operating lease to third parties. The future minimum lease payments due from lessees under those arrangements are $1 million per year for the years 2009 through 2013.
In July 2006, we amended and extended the lease on our corporate headquarters facility to 2019. As a result of this extension, we were required to re-evaluate the classification of this lease. Based on the terms of the extension, this lease is now classified as a capital lease and the related payments are included in the table above.
A significant portion of the equipment in our rental business is financed under capital leases. During the third quarter of 2006, we extended a lease related to a portion of our rental business by six years. The lease was set to expire on September 30, 2006. Instead of paying a balloon payment of approximately $42 million on September 30, 2006, the amount was financed over a six year term at a fixed rate. In addition to extending this lease, we reduced the interest rate by approximately 2 percentage points. During the fourth quarter of 2006, we refinanced a lease related to another portion of our rental business. Under the terms of the agreement which was effective January 1, 2007, the new lease has a six year term with a fixed rate that is approximately 2 percentage points lower than the existing lease. The total amount refinanced was approximately $28 million. These two leases are with two different lessors. Under each lease we are permitted to prepay, subject to certain conditions, the outstanding balance under the lease for the principal amount outstanding plus a prepayment penalty. For each of these leases we have the option to purchase the equipment at the end of the lease
118
CUMMINS INC. AND SUBSIDIARIES
NOTES TO CONSOLIDATED FINANCIAL STATEMENTS (Continued)
NOTE 19. LEASES (Continued)
term for one dollar. The equipment under these leases is capitalized and amortized over its estimated useful life. As of December 31, 2008 and 2007, we had outstanding capital leases under this program of $43 million and $58 million, respectively. Future lease payments, including repurchase obligations, under each lease are included in the table above.
Sale and Leaseback Transaction
In 2001, we entered into a sale-leaseback agreement whereby we sold and leased back certain heavy-duty engine manufacturing equipment from a grantor trust wholly-owned by a financial institution. The lease was classified as an operating lease with a lease term of 11.5 years, expiring June 28, 2013, and included an early buyout purchase option on January 14, 2009, which we did not exercise. The early buyout option could have been exercised for approximately $35 million, or 28 percent of the equipment's fair market value at the inception of the lease.
The lease agreement includes certain default provisions requiring us to make timely rent payments, maintain, service, repair and insure the equipment, procure residual value insurance and maintain minimum debt ratings for our long-term senior unsecured debt obligations.
In December 2003, the grantor trust which acts as the lessor in the sale and leaseback transaction described above was consolidated due to the adoption of FIN 46(R). A description of the entity consolidated and the impact of adopting FIN 46(R) are described in Note 22. As a result of the consolidation, the manufacturing equipment and the trust's obligations under its non-recourse debt arrangement are included in our Consolidated Balance Sheets as property, plant and equipment and long-term debt, respectively. The non-recourse debt arrangement is more fully discussed in Note 10. In addition, our Consolidated Statements of Income includes interest expense on the lessor's debt obligations and depreciation expense on the manufacturing equipment rather than rent expense under the lease agreement. The amount of interest expense in 2008, 2007 and 2006 was $1 million, $4 million and $5 million, respectively. The amount of depreciation expense in 2008, 2007 and 2006 was $14 million, $12 million and $17 million, respectively.
NOTE 20. SALES OF ACCOUNTS RECEIVABLE
In January 2004, we entered into a three-year facility agreement with a financial institution to sell a designated pool of trade receivables to Cummins Trade Receivables, LLC (CTR), a wholly-owned special purpose subsidiary. In July 2007, we amended the agreement to extend the facility until July 2010, and raised the purchase limitation from $200 million to $400 million. The agreement also provides us with an option to increase the purchase limitation up to $500 million upon approval. As necessary, CTR may transfer a direct interest in its receivables, without recourse, to the financial institution. To maintain a balance in the designated pools of receivables sold, we sell new receivables to CTR as existing receivables are collected. Receivables sold to CTR in which an interest is not transferred to the financial institution are included in "Receivables, net" on our Consolidated Balance Sheets. The maximum interest in sold receivables that can be outstanding at any point in time is limited to the lesser of $400 million or the amount of eligible receivables held by CTR. There are no provisions in this agreement that require us to maintain a minimum investment credit rating; however, the terms of the agreement contain the same financial covenants as our revolving credit facility (see Note 10). As of December 31, 2008, the amount available under this program was $170 million. As of December 31, 2008 and 2007, there were no amounts outstanding under this program.
119
CUMMINS INC. AND SUBSIDIARIES
NOTES TO CONSOLIDATED FINANCIAL STATEMENTS (Continued)
NOTE 20. SALES OF ACCOUNTS RECEIVABLE (Continued)
No accounts receivable sold to CTR were written off during 2008, 2007 or 2006. The sold receivables servicing portfolio, which is included in receivables and the proceeds from the sale of receivables and other related cash flows are as follows:
| |
As of and for the years ended December 31, | |||||||||
|---|---|---|---|---|---|---|---|---|---|---|
| |
2008 | 2007 | 2006 | |||||||
| |
in millions |
|||||||||
Sold receivables servicing portfolio |
$ | 652 | $ | 759 | $ | 719 | ||||
Receivables sold to special purpose subsidiary |
6,694 | 6,615 | 6,368 | |||||||
Collections reinvested in special purpose subsidiary |
6,801 | 6,575 | 6,254 | |||||||
Servicing fees and interest |
1 | 1 | 1 | |||||||
During 2008 we purchased a majority interest in three previously independent North American distributors in order to increase our ownership interests in key portions of the distribution channel. The acquisitions were accounted for under the purchase method of accounting and resulted in an aggregate purchase price of $81 million which we funded with $54 million of borrowings and $27 million of cash. The assets of the acquired businesses were primarily accounts receivable, inventory and fixed assets. There was less than $1 million of goodwill generated from these transactions. During the first three months of 2007, we purchased the remaining interest in a manufacturing joint venture and acquired ownership of an international independent distributor for approximately $20 million. We recorded goodwill of $13 million for these two transactions.
In July 2008, we entered into a transaction with two Fiat group companies to (1) sell our one-third interest in the European Engine Alliance (EEA) joint venture and simultaneously (2) purchase the remaining 50 percent interest in Consolidated Diesel Corporation (CDC). As a result, we now own 100 percent of CDC and no longer have an ownership interest in EEA. CDC was previously included in our consolidated results as we were considered the primary beneficiary under FASB Interpretation No. 46 (revised December 2003), "Consolidation of Variable Interest Entities" (FIN 46R). We sold our remaining interest in EEA for $64 million and subsequently purchased the remaining interest in CDC for $61 million, however, because the transactions were entered into simultaneously with the same counterparty, it is considered a non-monetary exchange for accounting purposes. Thus, we accounted for the transactions at fair value in accordance with FASB Statement 153 "Exchanges of Nonmonetary Assets." Because fair value and book value were reasonably close, there was no material gain or loss recorded on the sale of EEA. In addition, there were no significant adjustments from book value for any assets or liabilities of CDC recorded upon the acquisition of the remaining 50 percent interest.
NOTE 22. VARIABLE INTEREST ENTITIES
We consolidate certain VIEs if we are deemed to be the primary beneficiary, defined in FASB Interpretation No. 46(R), "Consolidation of Variable Interest Entities," (FIN 46(R)) as the entity that absorbs a majority of the VIEs' expected losses, receives a majority of the VIEs' expected residual returns, or both. We have variable interests in certain businesses accounted for under the equity method of accounting that are deemed VIEs and are subject to the provisions of FIN 46(R).
120
CUMMINS INC. AND SUBSIDIARIES
NOTES TO CONSOLIDATED FINANCIAL STATEMENTS (Continued)
NOTE 22. VARIABLE INTEREST ENTITIES (Continued)
During 2001, we entered into a sale-leaseback transaction with a financial institution with regard to certain heavy-duty engine manufacturing equipment. The accounting for the original sale-leaseback transaction is discussed in Note 19. The financial institution created a grantor trust to act as the lessor in the arrangement. The financial institution owns 100 percent of the equity in the trust. The grantor trust has no assets other than the equipment and its rights to the lease agreement with us. On the initial sale, we received $125 million from the financial institution which was financed with $99 million of non-recourse debt and $26 million of equity. Our obligations to the grantor trust consist of the payments due under the lease and a $9 million guarantee of the residual value of the equipment. In addition, we had a fixed price purchase option that was exercisable on January 14, 2009, for approximately $35 million; however, we decided not to exercise this option as discussed in Note 19. We have determined that the grantor trust is a VIE under FIN 46(R) and due primarily to the existence of the residual value guarantee, we determined that we are the primary beneficiary of the VIE. As a result, we began consolidating the grantor trust as of December 31, 2003, even though we do not own any of its equity. In April 2008, we made the final payment on the non-recourse debt.
Cummins Komatsu Engine Corporation (CKEC) is an engine manufacturing entity jointly owned and operated by us and our equity partner. We were deemed the primary beneficiary of this VIE due to the pricing arrangements of purchases and the substantial volume of purchases we made from the VIE. As of December 31, 2008, CKEC has no unsecured debt. Creditors of this entity have no recourse to the general credit of Cummins. Conversely, creditors of Cummins have no recourse to the assets of CKEC.
Results of CKEC for the year ended December 31, 2008, are included in our Consolidated Statements of Income and a significant amount of their sales are eliminated in consolidation. The table below shows the amount of assets and liabilities from CKEC included in our consolidated results, after eliminating intercompany items, as of December 31, 2008:
| |
Increase | |||
|---|---|---|---|---|
| |
in millions |
|||
Current assets (Primarily inventory) |
$ | 10 | ||
Long-term assets |
7 | |||
Current liabilities |
3 | |||
We also have variable interests in three North American distributors that were deemed to be VIEs in accordance with FIN 46(R), but we were not deemed to be the primary beneficiary since we do not absorb a majority of the entity's expected losses. Our ownership percentage in these entities ranges from 30 percent to 46 percent. For all three of these entities, our equity ownership represents our only variable interest in the entity and thus we would not be deemed the primary beneficiary.
The principal business of the distributors is to sell Cummins engines and related service parts as well as provide repair and maintenance services on engines, including warranty repairs. Our maximum potential loss related to these three distributors as of December 31, 2008, consisted of our ownership interest totaling $25 million. In addition, under certain circumstances, we could be required to repurchase certain assets of these distributors at amounts approximating fair value as more fully discussed in Note 13. Our involvement with these distributors as equity holders began in 2005, 2003
121
CUMMINS INC. AND SUBSIDIARIES
NOTES TO CONSOLIDATED FINANCIAL STATEMENTS (Continued)
NOTE 22. VARIABLE INTEREST ENTITIES (Continued)
and 2002. Selected financial information for these distributors as of and for the year ended December 31, 2008, is as follows:
| |
in millions | |||
|---|---|---|---|---|
Total assets |
$ | 261 | ||
Total liabilities (including total debt of $54) |
140 | |||
Revenues |
802 | |||
Net income |
68 | |||
Consolidated Diesel Corporation was an engine manufacturing entity jointly owned 50/50 by us and our equity partners. In 2006, 2007 and the first 6 months of 2008, we consolidated this entity under the provisions on FIN 46(R) due to the pricing arrangements on purchases from CDC and the substantial volume of purchases we made. In July 2008, we purchased the remaining 50 percent of CDC and we now own 100 percent of the voting interest. As a result, FIN 46(R) no longer applies to this entity.
Cummins Eastern Canada (CEC) is a joint venture in which we currently own a 50 percent interest. In 2006, we had a 51 percent ownership interest, but only a 50 percent voting interest. In addition, we had loaned our partner funds to purchase 16 percent of the equity. In accordance with FIN 46(R), CEC was consolidated in our Consolidated Financial Statements due to our economic interest and the loan to the other partner. In January 2007, our partner repaid the balance due on the loan and exercised a purchase option on a one percent equity interest bringing the economic interest to 50/50 in line with the voting interest. The repayment of the loan and exercise of the purchase option triggered a reassessment under FIN 46(R), resulting in the deconsolidation of CEC. The results of CEC are now included only as an equity method investment.
NOTE 23. OTHER (EXPENSE) INCOME
Other (expense) income included the following:
| |
Years ended December 31, | |||||||||
|---|---|---|---|---|---|---|---|---|---|---|
| |
2008 | 2007 | 2006 | |||||||
| |
in millions |
|||||||||
Other (expense) income: |
||||||||||
Change in cash surrender value of corporate owned life insurance |
$ | (36 | ) | $ | — | $ | — | |||
Loss on early extinguishment of debt |
— | — | (12 | ) | ||||||
Bank charges |
(12 | ) | (12 | ) | (14 | ) | ||||
Foreign currency (losses) gains |
(46 | ) | 28 | 11 | ||||||
Other, net |
24 | 17 | 16 | |||||||
Total other (expense) income, net |
$ | (70 | ) | $ | 33 | $ | 1 | |||
122
CUMMINS INC. AND SUBSIDIARIES
NOTES TO CONSOLIDATED FINANCIAL STATEMENTS (Continued)
SFAS No. 131, "Disclosures about Segments of an Enterprise and Related Information," set standards for reporting information regarding operating segments in financial statements. Operating segments are defined as components of an enterprise about which separate financial information is available that is evaluated regularly by the chief operating decision-maker, or decision making group, in deciding how to allocate resources and in assessing performance. Cummins chief operating decision-maker (CODM) is the Chief Executive Officer.
Our reportable operating segments consist of the following: Engine, Power Generation, Components and Distribution. This reporting structure is organized according to the products and markets each segment serves. This type of reporting structure allows management to focus its efforts on providing enhanced service to a wide range of customers. The Engine segment produces engines and parts for sale to customers in on-highway and various industrial markets. The engines are used in trucks of all sizes, buses and recreational vehicles, as well as various industrial applications including construction, mining, agriculture, marine, oil and gas, rail and military. The Power Generation segment is an integrated provider of power systems which sells engines, generator sets and alternators and rents power equipment for both standby and prime power uses. The Components segment includes sales of filtration products, exhaust and aftertreatment systems, turbochargers and fuel systems. The Distribution segment includes wholly-owned and partially-owned distributorships engaged in wholesaling engines, generator sets, and service parts, as well as performing service and repair activities on our products and maintaining relationships with various original equipment manufacturers.
We use segment EBIT (defined as earnings before interest expense, taxes and minority interests) as a primary basis for the CODM to evaluate the performance of each of our operating segments. Segment amounts exclude certain expenses not specifically identifiable to segments.
The accounting policies of our operating segments are the same as those applied in the Consolidated Financial Statements. We prepared the financial results of our operating segments on a basis that is consistent with the manner in which we internally disaggregate financial information to assist in making internal operating decisions. We have allocated certain common costs and expenses, primarily corporate functions, among segments differently than we would for stand-alone financial information prepared in accordance with GAAP. These include certain costs and expenses of shared services, such as information technology, human resources, legal and finance. We also do not allocate debt-related items, actuarial gains and losses, prior service costs or credits, restructuring charges, investment gains or losses, flood damage, or income taxes to individual segments. Segment EBIT may not be consistent with measures used by other companies.
123
CUMMINS INC. AND SUBSIDIARIES
NOTES TO CONSOLIDATED FINANCIAL STATEMENTS (Continued)
NOTE 24. OPERATING SEGMENTS (Continued)
Summarized financial information regarding our reportable operating segments at December 31, is shown in the table below:
| |
Engine | Power Generation |
Components | Distribution | Non- segment items(1) |
Total | ||||||||||||||
|---|---|---|---|---|---|---|---|---|---|---|---|---|---|---|---|---|---|---|---|---|
| |
in millions |
|||||||||||||||||||
2008 |
||||||||||||||||||||
External sales |
$ | 7,432 | $ | 2,601 | $ | 2,154 | $ | 2,155 | $ | — | $ | 14,342 | ||||||||
Intersegment sales |
1,378 | 899 | 998 | 9 | (3,284 | ) | — | |||||||||||||
Net sales |
8,810 | 3,500 | 3,152 | 2,164 | (3,284 | ) | 14,342 | |||||||||||||
Depreciation and amortization(2) |
180 | 41 | 65 | 25 | — | 311 | ||||||||||||||
Research, development and engineering expense |
286 | 41 | 95 | — | — | 422 | ||||||||||||||
Equity, royalty and interest income from investees |
99 | 23 | 14 | 117 | — | 253 | ||||||||||||||
Restructuring charges |
— | — | — | — | 37 | 37 | ||||||||||||||
Interest income |
10 | 3 | 3 | 2 | — | 18 | ||||||||||||||
Segment EBIT |
535 | 376 | 169 | 242 | (102 | ) | 1,220 | |||||||||||||
Net assets |
1,623 | 1,024 | 1,295 | 678 | — | 4,620 | ||||||||||||||
Investment in and advances to equity investees |
287 | 52 | 91 | 158 | — | 588 | ||||||||||||||
Capital expenditures |
331 | 57 | 139 | 16 | — | 543 | ||||||||||||||
2007 |
||||||||||||||||||||
External sales |
$ | 7,129 | $ | 2,375 | $ | 2,007 | $ | 1,537 | $ | — | $ | 13,048 | ||||||||
Intersegment sales |
1,053 | 685 | 925 | 3 | (2,666 | ) | — | |||||||||||||
Net sales |
8,182 | 3,060 | 2,932 | 1,540 | (2,666 | ) | 13,048 | |||||||||||||
Depreciation and amortization(2) |
176 | 42 | 59 | 11 | — | 288 | ||||||||||||||
Research, development and engineering expense |
222 | 34 | 73 | — | — | 329 | ||||||||||||||
Equity, royalty and interest income from investees |
92 | 17 | 4 | 92 | — | 205 | ||||||||||||||
Interest income |
26 | 6 | 3 | 1 | — | 36 | ||||||||||||||
Segment EBIT |
589 | 334 | 153 | 187 | (36 | ) | 1,227 | |||||||||||||
Net assets |
1,727 | 931 | 1,270 | 506 | — | 4,434 | ||||||||||||||
Investment in and advances to equity investees |
327 | 24 | 51 | 112 | — | 514 | ||||||||||||||
Capital expenditures |
189 | 51 | 99 | 14 | — | 353 | ||||||||||||||
2006 |
||||||||||||||||||||
External sales |
$ | 6,640 | $ | 1,880 | $ | 1,473 | $ | 1,369 | $ | — | $ | 11,362 | ||||||||
Intersegment sales |
871 | 536 | 808 | 16 | (2,231 | ) | — | |||||||||||||
Net sales |
7,511 | 2,416 | 2,281 | 1,385 | (2,231 | ) | 11,362 | |||||||||||||
Depreciation and amortization(2) |
192 | 36 | 57 | 11 | — | 296 | ||||||||||||||
Research, development and engineering expense |
225 | 28 | 68 | — | — | 321 | ||||||||||||||
Equity, royalty and interest income from investees |
67 | 12 | 7 | 54 | — | 140 | ||||||||||||||
Interest income |
36 | 7 | 2 | 2 | — | 47 | ||||||||||||||
Segment EBIT |
733 | 220 | 107 | 144 | (25 | ) | 1,179 | |||||||||||||
Net assets |
1,698 | 850 | 1,063 | 445 | — | 4,056 | ||||||||||||||
Investment in and advances to equity investees |
213 | 23 | 40 | 69 | — | 345 | ||||||||||||||
Capital expenditures |
125 | 45 | 70 | 9 | — | 249 | ||||||||||||||
124
CUMMINS INC. AND SUBSIDIARIES
NOTES TO CONSOLIDATED FINANCIAL STATEMENTS (Continued)
NOTE 24. OPERATING SEGMENTS (Continued)
A reconciliation of our segment information to the corresponding amounts in the Consolidated Financial Statements is shown in the table below:
| |
Years ended December 31, | ||||||||||
|---|---|---|---|---|---|---|---|---|---|---|---|
| |
2008 | 2007 | 2006 | ||||||||
| |
in millions |
||||||||||
Segment EBIT |
$ | 1,220 | $ | 1,227 | $ | 1,179 | |||||
Less: |
|||||||||||
Interest expense |
42 | 58 | 96 | ||||||||
Income before income taxes and minority interests |
$ | 1,178 | $ | 1,169 | $ | 1,083 | |||||
| |
December 31, | |||||||||
|---|---|---|---|---|---|---|---|---|---|---|
| |
2008 | 2007 | 2006 | |||||||
| |
in millions |
|||||||||
Net assets for operating segments |
$ | 4,620 | $ | 4,434 | $ | 4,056 | ||||
Liabilities deducted in arriving at net assets |
4,186 | 3,759 | 3,510 | |||||||
Pension and other postretirement benefit adjustments excluded from net assets |
(1,150 | ) | (570 | ) | (837 | ) | ||||
Deferred tax assets not allocated to segments |
838 | 546 | 710 | |||||||
Debt-related costs not allocated to segments |
25 | 26 | 26 | |||||||
Total assets |
$ | 8,519 | $ | 8,195 | $ | 7,465 | ||||
125
CUMMINS INC. AND SUBSIDIARIES
NOTES TO CONSOLIDATED FINANCIAL STATEMENTS (Continued)
NOTE 24. OPERATING SEGMENTS (Continued)
The table below presents certain segment information by geographic area. Net sales attributed to geographic areas are based on the location of the customer.
| |
Years ended and as of December 31, |
|||||||||
|---|---|---|---|---|---|---|---|---|---|---|
| |
2008 | 2007 | 2006 | |||||||
| |
in millions |
|||||||||
Net sales |
||||||||||
United States |
$ | 5,817 | $ | 6,007 | $ | 5,719 | ||||
Brazil |
866 | 649 | 418 | |||||||
China |
783 | 603 | 388 | |||||||
India |
702 | 619 | 425 | |||||||
United Kingdom |
692 | 621 | 463 | |||||||
Canada |
619 | 405 | 743 | |||||||
Other foreign countries |
4,863 | 4,144 | 3,206 | |||||||
Total net sales |
$ | 14,342 | $ | 13,048 | $ | 11,362 | ||||
Long-lived assets |
||||||||||
United States |
$ | 1,764 | $ | 1,677 | $ | 1,397 | ||||
Brazil |
124 | 122 | 112 | |||||||
China |
342 | 170 | 96 | |||||||
India |
114 | 105 | 61 | |||||||
United Kingdom |
177 | 289 | 207 | |||||||
Canada |
26 | 31 | 37 | |||||||
Other foreign countries |
183 | 176 | 150 | |||||||
Total long-lived assets |
$ | 2,730 | $ | 2,570 | $ | 2,060 | ||||
126
SELECTED QUARTERLY FINANCIAL DATA
UNAUDITED
| |
First Quarter |
Second Quarter |
Third Quarter |
Fourth Quarter |
||||||||||
|---|---|---|---|---|---|---|---|---|---|---|---|---|---|---|
| |
2008 | |||||||||||||
| |
in millions (except per share amounts) |
|||||||||||||
Net sales |
$ | 3,474 | $ | 3,887 | $ | 3,693 | $ | 3,288 | ||||||
Gross margin |
707 | 879 | 820 | 534 | ||||||||||
Net income |
190 | 293 | 229 | 43 | ||||||||||
Net earnings per share—basic |
$ | 0.97 | $ | 1.50 | $ | 1.18 | $ | 0.22 | ||||||
Net earnings per share—diluted(a) |
$ | 0.97 | $ | 1.49 | $ | 1.17 | $ | 0.22 | ||||||
Dividends per share |
$ | 0.125 | $ | 0.125 | $ | 0.175 | $ | 0.175 | ||||||
Stock price per share |
||||||||||||||
High |
$ | 64.17 | $ | 75.09 | $ | 75.98 | $ | 45.63 | ||||||
Low |
$ | 38.11 | $ | 46.10 | $ | 44.05 | $ | 17.70 | ||||||
| |
2007 | |||||||||||||
|---|---|---|---|---|---|---|---|---|---|---|---|---|---|---|
Net sales |
$ | 2,817 | $ | 3,343 | $ | 3,372 | $ | 3,516 | ||||||
Gross margin |
552 | 670 | 652 | 682 | ||||||||||
Net income |
143 | 214 | 184 | 198 | ||||||||||
Net earnings per share—basic(a) |
$ | 0.72 | $ | 1.07 | $ | 0.93 | $ | 1.01 | ||||||
Net earnings per share—diluted(a) |
$ | 0.71 | $ | 1.06 | $ | 0.92 | $ | 1.00 | ||||||
Dividends per share |
$ | 0.09 | $ | 0.09 | $ | 0.125 | $ | 0.125 | ||||||
Stock price per share |
||||||||||||||
High |
$ | 37.99 | $ | 53.62 | $ | 70.13 | $ | 71.73 | ||||||
Low |
$ | 28.16 | $ | 36.01 | $ | 48.00 | $ | 51.84 | ||||||
At December 31, 2008, there were approximately 3,711 holders of record of Cummins Inc.'s $2.50 par value common stock.
127
Pursuant to the requirements of Section 13 or 15(d) of the Securities Exchange Act of 1934, the registrant has duly caused this report to be signed on its behalf by the undersigned, thereunto duly authorized.
| CUMMINS INC. | ||||||
By: |
/s/ PATRICK J. WARD Patrick J. Ward Vice President and Chief Financial Officer (Principal Financial Officer) |
By: |
/s/ MARSHA L. HUNT Marsha L. Hunt Vice President—Corporate Controller (Principal Accounting Officer) |
|||
Date: February 27, 2009
Pursuant to the requirements of the Securities Exchange Act of 1934, this report has been signed below by the following persons on behalf of the registrant and in the capacities and on the dates indicated.
Signatures
|
Title
|
Date
|
||||
|---|---|---|---|---|---|---|
| * Theodore M. Solso |
Chairman of the Board of Directors and Chief Executive Officer (Principal Executive Officer) | February 27, 2009 | ||||
* F. Joseph Loughrey |
Director, Vice Chairman |
February 27, 2009 |
||||
* Robert J. Bernhard |
Director |
February 27, 2009 |
||||
* Robert J. Darnall |
Director |
February 27, 2009 |
||||
* Robert K. Herdman |
Director |
February 27, 2009 |
||||
* Alexis M. Herman |
Director |
February 27, 2009 |
||||
* William I. Miller |
Director |
February 27, 2009 |
||||
* Georgia R. Nelson |
Director |
February 27, 2009 |
||||
* Carl Ware |
Director |
February 27, 2009 |
||||
* J. Lawrence Wilson |
Director |
February 27, 2009 |
||||
By: |
/s/ PATRICK J. WARD Patrick J. Ward Attorney-in-fact |
|||||
128
| Exhibit No. | Description of Exhibit | ||
|---|---|---|---|
| 3(a) | Restated Articles of Incorporation of Cummins Inc., as amended (incorporated by reference to DEF 14A dated April 3, 2008, incorporated by reference to DEF 14A dated April 5, 2007, by reference to Quarterly Report on Form 10-Q for the quarter ended March 25, 2001, by reference to Quarterly Report on Form 10-Q for the quarter ended April 3, 1994, by reference to Quarterly Report on Form 10-Q for the quarter ended October 1, 1989 and by reference to Form 8-K dated July 26, 1990). | ||
3(b) |
By-laws of Cummins Inc., as amended and restated effective as of October 8, 2002 (incorporated by reference to Form 8-K dated February 14, 2008, by reference to Form 8-K dated December 18, 2006, by reference to Form 8-K dated May 12, 2006, by reference to Form 8-K dated February 16, 2006, by reference to Annual Report on Form 10-K for the year ended December 31, 2003). |
||
10(a) |
2003 Stock Incentive Plan, as amended (incorporated by reference to Annual Report on Form 10-K for the year ended December 31, 2006). |
||
10(b) |
Target Bonus Plan (incorporated by reference to Annual Report on Form 10-K for the year ended December 31, 1996). |
||
10(c) |
Deferred Compensation Plan (incorporated by reference to Annual Report on Form 10-K for the year ended December 31, 1994). |
||
10(d) |
Key Employee Stock Investment Plan, as amended (incorporated by reference to Quarterly Report on Form 10-Q for the quarter ended July 3, 1994). |
||
10(e) |
Supplemental Life Insurance and Deferred Income Plan (incorporated by reference to Annual Report on Form 10-K for the year ended December 31, 1996). |
||
10(f) |
Financial Counseling Program (incorporated by reference to Quarterly Report on Form 10-Q for the quarter ended July 3, 1994). |
||
10(g) |
Three Year Revolving Credit Agreement, dated June 30, 2008 (incorporated by reference to Quarterly Report on Form 10-Q for the quarter ended June 29, 2008). |
||
10(h) |
Deferred Compensation Plan for Non-Employee Directors, as amended, effective as of April 15, 1994 (incorporated by reference to Annual Report on Form 10-K for the year ended December 31, 1994). |
||
10(i) |
Key Executive Compensation Protection Plan (incorporated by reference to Quarterly Report on Form 10-Q for the quarter ended October 2, 1994). |
||
10(j) |
Excess Benefit Retirement Plan (incorporated by reference to Quarterly Report on Form 10-Q for the quarter ended October 2, 1994). |
||
10(k) |
Employee Stock Purchase Plan (incorporated by reference to Annual Report on Form 10-K for the year ended December 31, 1998). |
||
10(l) |
Three Year Performance Plan, as amended February 1997 (incorporated by reference to Quarterly Report on Form 10-Q for the quarter ended March 30, 1997). |
||
10(m) |
Restricted Stock Plan for Non-Employee Directors, as amended February 11, 1997 (incorporated by reference to Quarterly Report on Form 10-Q for the quarter ended March 30, 1997). |
||
129
| Exhibit No. | Description of Exhibit | ||
|---|---|---|---|
| 10(n) | 2006 Executive Retention Plan (incorporated by reference to Annual Report on Form 10-K for the year ended December 31, 2005). | ||
10(o) |
Senior Executive Bonus Plan (incorporated by reference to Annual Report on Form 10-K for the year ended December 31, 1996). |
||
10(p) |
Senior Executive Three Year Performance Plan, as amended February 11, 1997 (incorporated by reference to Quarterly Report on Form 10-Q for the quarter ended March 30, 1997). |
||
10(q) |
Fifth Amendment of Cummins Inc. Supplemental Life Insurance and Deferred Income Plan (incorporated by reference to Annual Report on Form 10-K for the year ended December 31, 2005). |
||
12 |
Calculation of Ratio of Earnings to Fixed Charges (filed herewith). |
||
21 |
Subsidiaries of the Registrant (filed herewith). |
||
23 |
Consent of PricewaterhouseCoopers LLP (filed herewith). |
||
24 |
Powers of Attorney (filed herewith). |
||
31(a) |
Certification Pursuant to Section 302 of the Sarbanes-Oxley Act of 2002 (filed herewith). |
||
31(b) |
Certification Pursuant to Section 302 of the Sarbanes-Oxley Act of 2002 (filed herewith). |
||
32 |
Certifications Pursuant to Section 906 of the Sarbanes-Oxley Act of 2002 (filed herewith). |
||
130